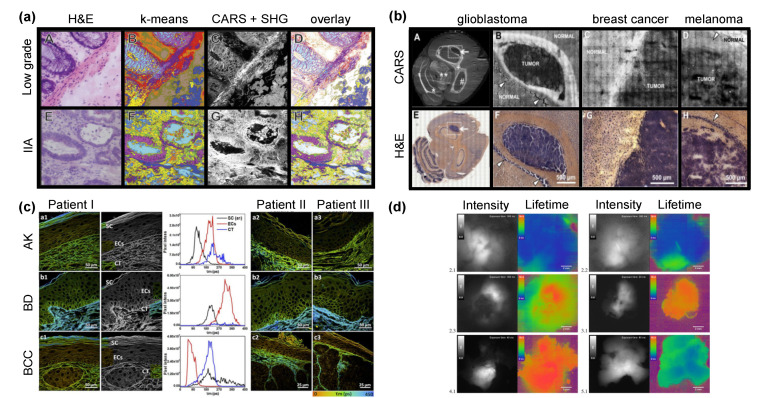
Figure 2.
Application of Raman and FLIM imaging to discriminate tumor tissues. (a) Imaging of tissues from patients with low grade (A–D) and stage IIA (E–H) colorectal carcinoma. H&E staining (A, E), K-means clustering result of CARS spectra in the 2700–3000 cm−1 region (B, F), combined images of second harmonic generation (SHG) intensities at 408 nm and CARS signals at 2850 cm−1 (C, G) and overlay of k-means clustering with SHG and CARS (D, H) are shown. Reprinted with permission from [110]. (b) CARS (A–D) and H&E (E–H) imaging of mouse brain sections with an experimental human U87MG glioblastoma (A, B), breast cancer metastasis induced by MCF-7 cells (C) and melanoma induced by A375 cells (D). White matter of brain and normal tissue appears brighter in CARS images, while the tumor regions are darker. Reprinted with permission from [119]. (c) FLIM images of skin sections from actinic keratosis (AK), Bowen’s disease (BD), and basal cell carcinoma (BCC). The corresponding color-coding scheme ranges from red (0 ps) to blue (450 ps). For each patient and disease type, the mean fluorescence lifetimes (τm) of stratum corneum (SC, black line), epithelial cells (EC, red line), and dermal connective tissue (CT, blue line) were compared. Reprinted with permission from [124]. (d) 5-ALA fluorescence intensity (grey scale) and FLIM images (color) of brain tumor samples. Infiltrating tumor tissues characterized by increased lifetimes in green (2.1, 2.2), focal glial cell infiltration (2.3), strong 5-ALA positive fluorescence, according to increased lifetimes in red (3.1, 4.1) and glioblastoma with minimal infiltration of tumor cells are demonstrated (5.1). Areas in purple correspond to areas outside of the sample. Scale bars are equal to 2 mm. Reprinted with permissions from [125].

