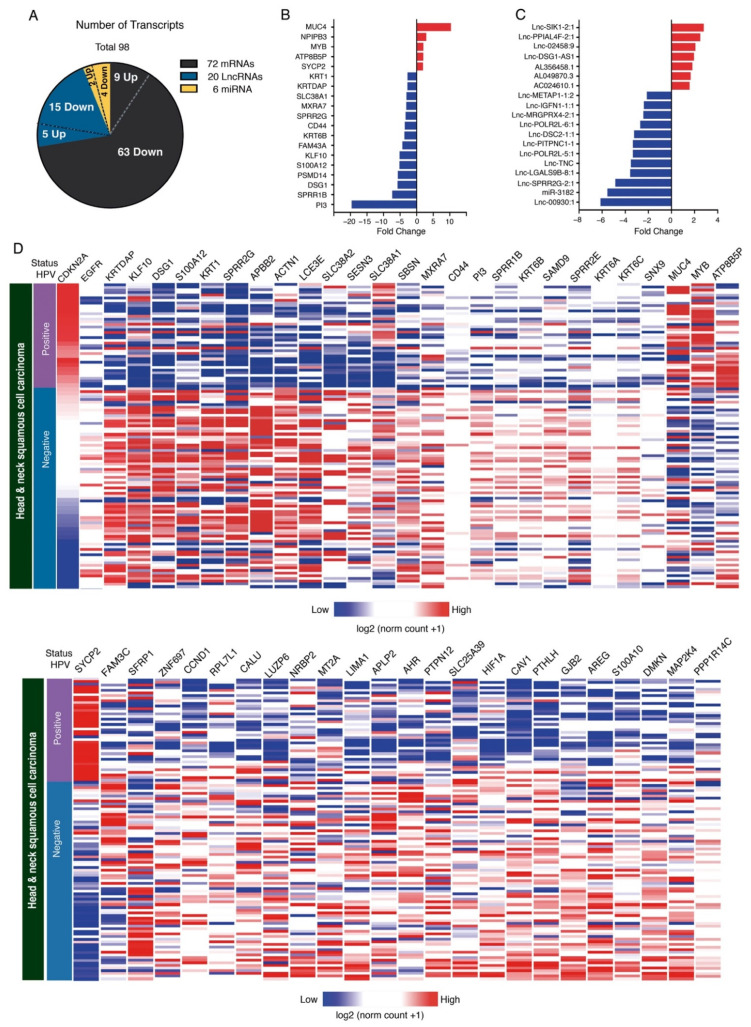
Figure 2.
Transcriptome changes in HNSCC patients associated with presence or absence of HPV and p16. (A) Graph shows the classification of differentially expressed transcripts in HPV+/p16+ samples versus HPV−/p16− samples in tissues with HNSCC. Main differentially expressed mRNAs (B) and lncRNAs (C) in HPV+/p16+ vs. HPV−/p16− samples. (D) Heat map showing gene expression between HPV+ tissues (n = 39) and HPV− tissues (n = 75) in HNSCC patients. Columns show the expression of each transcript validated in TCGA samples. Gene expression is shown in a range from red (greater) to blue (lesser).

