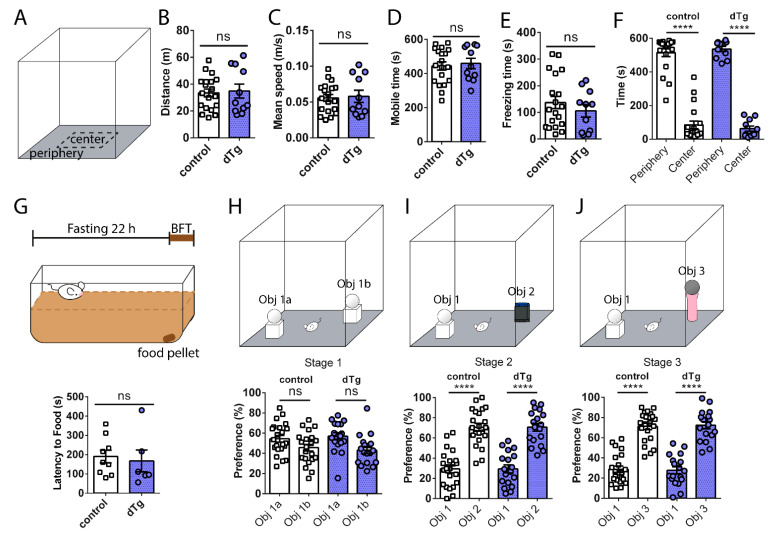
Figure 3.
Normal locomotor activity, anxiety, and olfactory behavior in dTg animals. (A) Schematic of open field test. No differences between control and dTg mice in (B) distance (t(28) = 0.2464, p = 0.8072), (C) mean speed (t(28) = 0.2403, p = 0.8118), (D) mobile time (t(28) = 0.3778, p = 0.7084), (E) freezing time (t(28) = 0.8859, p = 0.3832), and (F) time spent in periphery and center zones (F(1,28) = 187.1; p < 0.0001, post hoc control p < 0.0001, dTg p < 0.0001; between genotypes F(1,28) = 0.005496; p = 0.9414, post hoc p = 0.7674, control n = 19, dTg n = 11). (G) Schematic of buried food test; no differences between genotypes in olfaction (t(13) = 0.3735, p = 0.7148; control n = 9, dTg n = 6). (H–J top) Schematic of novel object recognition test. (H) No preference during stage 1 of the novel object recognition (F(1,38) = 5.387; p = 0.0258, post hoc control p = 0.1841, dTg p = 0.1244; between genotypes F(1,38) = 41.57; p < 0.0001, post hoc p = 0.8513; control n = 22, dTg n = 18). No difference in novelty preference, as determined by (I) stage 2 (F(1,38) = 56.54; p < 0.0001, post hoc control p < 0.0001, dTg p < 0.0001; between genotypes F(1,38) = 0.1587; p = 0.6926, post hoc p = 0.9997), and (J) stage 3 (F(1,38) = 84.13; p < 0.0001, post hoc control p < 0.0001, dTg p < 0.0001; between genotypes F(1,38) = 2.613; p = 0.1143, post hoc p = 0.9652), of the novel object recognition. dTg, double transgenic; BFT, buried food test; Obj, object. **** p < 0.0001, ns = no significance; two-tailed unpaired t-test for two group comparisons and two-way RM ANOVA followed by post hoc Holm–Sidak comparisons for more than two groups. Data are expressed as mean ± SEM. n = number of mice.

