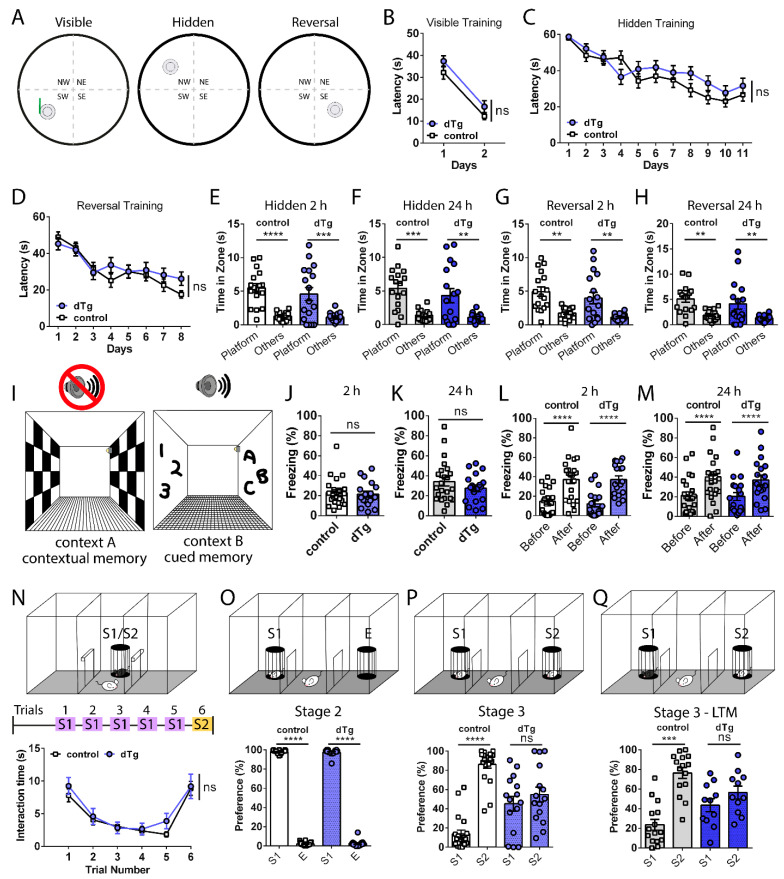
Figure 4.
Impaired social recognition memory in three-chamber social tests, but normal spatial and fear learning and memory, in dTg mice. (A) Schematics of visible, hidden, and reversal MWM training layout. No differences between control (n = 19) and dTg (n = 22) mice in escape latency during (B) visible platform (F(1,39) = 143.7; p < 0.0001, post hoc control p < 0.0001, dTg p < 0.0001; between genotypes F(1,39) = 2.280; p = 0.1391), (C) hidden platform (between genotypes F(1,39) = 0.9090; p = 0.3463), and (D) reversal platform (between genotypes F(1,39) = 0.3892; p = 0.5364). No differences between control (n = 17) and dTg (n = 17) mice during the hidden platform probe memory tests at (E) 2 h (F(1,32) = 41.77; p < 0.0001, post hoc control p < 0.0001, dTg p = 0.0003; between genotypes F(1,32) = 0.8153; p = 0.3733, post hoc platform p = 0.4650) and (F) 24 h (F(1,32) = 28.65; p < 0.0001, post hoc control p = 0.0004, dTg p = 0.0019; between genotypes F(1,32) = 1.264; p = 0.2692, post hoc platform p = 0.4308) or reversal platform probe tests at (G) 2 h (F(1,32) = 26.16; p < 0.0001, post hoc control p = 0.0012, dTg p = 0.0017; between genotypes F(1,32) = 2.325; p = 0.1372, post hoc platform p = 0.4064) and (H) 24 h (F(1,32) = 19.92; p < 0.0001, post hoc control p = 0.0038, dTg p = 0.0062; between genotypes F(1,32) = 1.709; p = 0.2004, post hoc platform p = 0.4709). (I) Schematics of context A and B used for fear conditioning. (J) Short-term 2 h contextual t(39) = 0.3345, p = 0.7398, (K) long-term 24 h contextual t(39) = 1.135, p = 0.2632, (L) short-term 2 h cued F(1,39) = 154.8; p < 0.0001, post hoc control p < 0.0001, dTg p < 0.0001; between genotypes F(1,39) = 0.07609; p = 0.7841, post hoc before p = 0.8592, after p = 0.9834, and (M) long-term 24 h cued F(1,39) = 46.40; p < 0.0001, post hoc control p < 0.0001, dTg p < 0.0001; between genotypes F(1,39) = 0.04173; p = 0.8392, post hoc before p = 0.9743, after p = 0.9743, fear conditioning memory tests showing no differences between control (n = 23) and dTg (n = 18) mice. (N) Schematic of the five-trial social interaction assay; no differences in social habituation and dishabituation of both groups to sex-matched, juvenile strangers (between genotypes F(1,45) = 1.157; p = 0.2878, post hoc trial 1 p = 0.8432, trial 5 p = 0.6180, trial 6 p = 0.9943, control n = 29, dTg n = 18). (O–Q top) Schematics of stage 2 and 3 of the three-chamber social interaction test. (O) Stage 2 showed similar sociability of control and dTg mice (F(1,33) = 11207; p < 0.0001, post hoc control p < 0.0001, dTg p < 0.0001, between genotypes F(1,33) = 0.01445; p = 0.9051, post hoc p = 0.7916, control n = 20, dTg n = 15). (P) During stage 3 F(1,33) = 25.67; p < 0.0001, post hoc control p < 0.0001, dTg p = 0.4397, between genotypes F(1,33) = 1.112; p = 0.2993, post hoc p = 0.0005, dTg mice showed impaired social recognition of a novel S2 compared with S1. (Q) Impaired social recognition memory tested 24 h later during stage 3 in dTg mice (F(1,24) = 14.88; p = 0.0008, post hoc control p = 0.0002, dTg p = 0.3293; between genotypes F(1,24) = 0.05879; p = 0.8105, post hoc p = 0.0459 control n = 15, dTg n = 11). MWM, Morris Water Maze; dTg, double transgenic; S1, stranger 1; S2, stranger 2; E, empty cage; LTM, long-term memory. ** p < 0.01, *** p < 0.001, **** p < 0.0001, ns = no significance. two-tailed unpaired t-test for two group comparisons and two-way RM ANOVA followed by post hoc Holm–Sidak comparisons for more than two groups. Data are expressed as mean ± SEM. n = number of mice.

