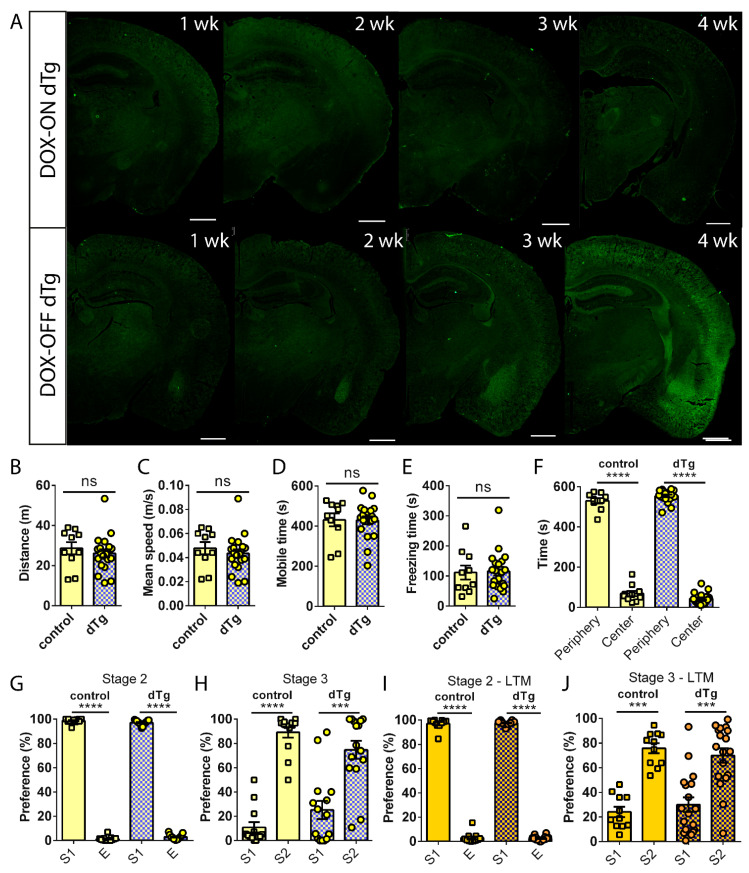
Figure 5.
DOX administration rescues social recognition deficits in dTg animals without affecting basal locomotor activity. (A) The global expression of mPAK3-GFP proteins in dorsal coronal dTg half brain sections after the gradual administration and removal of DOX. Scale bar = 1000 μm. (B–F) The locomotor and anxiety behavior of control and dTg mice during the open field test showing no significant differences after 4 weeks of DOX administration. No differences in (B) distance t(28) = 0.7009, p = 0.4891; (C) mean speed t(28) = 0.7231, p = 0.4756; (D) mobile time t(28) = 0.06681, p = 0.9472; (E) freezing time t(28) = 0.1653, p = 0.8699; and (F) time spent in periphery and center zones F(1,28) = 1379; p < 0.0001, post hoc control p < 0.0001, dTg p < 0.0001; between genotypes F(1,28) = 1.130; p = 0.2969, post hoc p = 0.1112) of the open field test. (G) Sociability was unaffected during stage 2 F(1,26) = 15911; p < 0.0001, post hoc control p < 0.0001, dTg p < 0.0001; between genotypes F(1,26) = 1.518; p = 0.2289, post hoc p = 0.0777, of the three-chamber social interaction test while rescuing basal short-term social recognition deficit during (H) stage 3 F(1,26) = 50.31; p < 0.0001, post hoc control p < 0.0001, dTg p = 0.0004; between genotypes F(1,26) = 0.1108; p = 0.7419, post hoc p = 0.2216, in dTg mice after 4 weeks of DOX administration; control n = 13, dTg n = 15. (I) Similar sociability in stage 2 LTM: F(1,27) = 6610; p < 0.0001, post hoc control p < 0.0001, dTg p < 0.0001; between genotypes F(1,27) = 3.379; p = 0.0770, post hoc p = 0.8692, and (J) social recognition rescue in stage 3 LTM: F(1,27) = 30.66; p < 0.0001, post hoc control p = 0.0010, dTg p = 0.0010; between genotypes F(1,27) = 0.7792; p = 0.3852, post hoc p = 0.7263; control n = 11, dTg n = 18). dTg, double transgenic; DOX, doxycycline; DOX-ON, on doxycycline; DOX-OFF, off doxycycline; S1, stranger 1; S2, stranger 2; E, empty cage; LTM, long-term memory. *** p < 0.001, **** p < 0.0001, ns = no significance; two-tailed unpaired t-test for two group comparisons and two-way RM ANOVA followed by post hoc Holm–Sidak comparisons for more than two groups. Data are expressed as mean ± SEM. n = number of mice.

