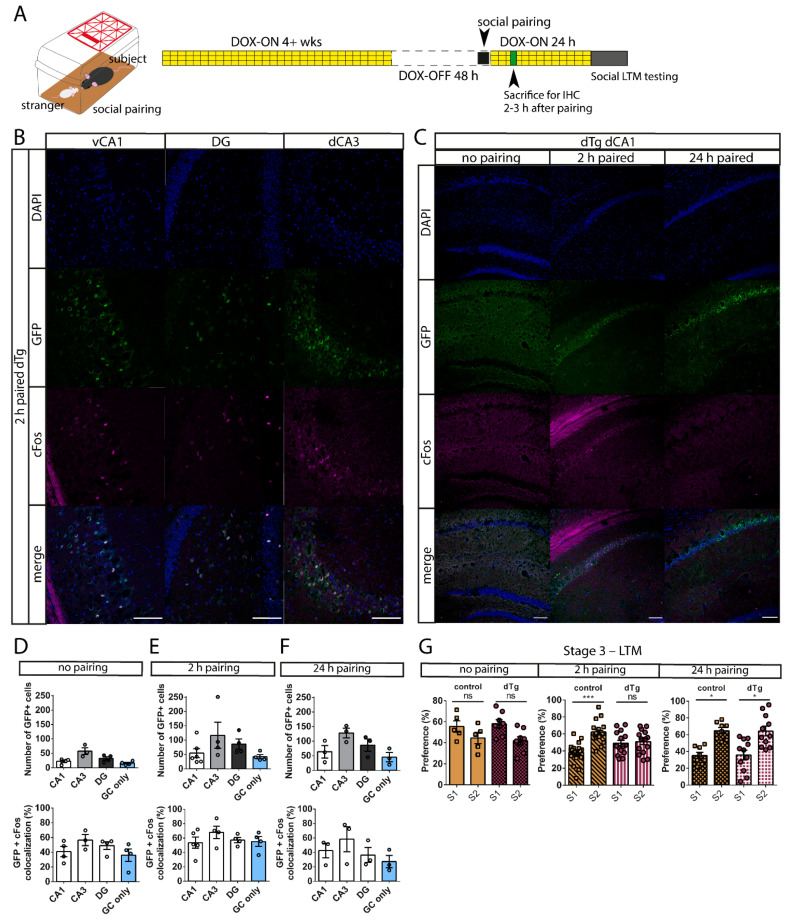
Figure 6.
Social pairing-induced expression of mPAK3-GFP proteins impairs social recognition memory. (A) Schematics showing home-cage social pairing and DOX administration and removal to induce expression of mPAK3-GFP proteins. (B) Sample immunostaining images showing the expression of mPAK3-GFP proteins and overlapping Fos protein expression in the vCA1, DG, and dCA3 of dTg mice after a 2 h social pairing interaction during the DOX-OFF window. Scale bars: 100 μm. (C) Sample immunostaining images showing the effects of different pairing durations during the DOX-OFF window on the mPAK3-GFP expression in the dCA1 of dTg mice. Scale bars: 100 μm. (D–F) Summary graphs showing the number of GFP-positive cells and percentage of GFP and Fos overlap over total GFP-positive cells in various hippocampal regions; (D) not paired CA1 n = 4, CA3 n = 3, DG n = 4; (E) 2 h paired CA1 n = 5, CA3 n = 4, DG n = 4; (F) 24 h paired CA1, CA3, DG n = 3. (G) A 2 h but not a 24 h social pairing interaction resulting in a social recognition deficit during stage 3 of the three-chamber social interaction test (no pairing: F(1,11) = 4.511; p = 0.0572, post hoc control p = 0.2968, dTg p = 0.1280; between genotypes F(1,11) = 0.6044; p = 0.4533, post hoc p = 0.9033; control n = 5, dTg n = 8; 2 h pairing: F(1,33) = 8.714; p = 0.0058, post hoc control p = 0.0004, dTg p = 0.7812; between genotypes F(1,33) = 0.04172; p = 0.8394, post hoc p = 0.0275; control n = 20, dTg n = 15; 24 h pairing: F(1,17) = 15.17; p = 0.0012, post hoc control p = 0.0185, dTg p = 0.0179; between genotypes F(1,17) = 0.1398; p = 0.7131, post hoc p = 0.9972; control n = 8, dTg n = 11). dCA1, dorsal CA1; dCA3, dorsal CA3; vCA1, ventral CA1; DG, dentate gyrus; GC, granule cell of dentate gyrus; DOX-ON, on doxycycline; DOX-OFF, off doxycycline; S1, stranger 1; S2, stranger 2; LTM, long-term memory; dTg, double transgenic. * p < 0.05, *** p < 0.001, ns = no significance; two-tailed unpaired t-test for two group comparisons and two-way RM ANOVA followed by post hoc Holm–Sidak comparisons for more than two groups. Data are expressed as mean ± SEM. n = number of mice.

