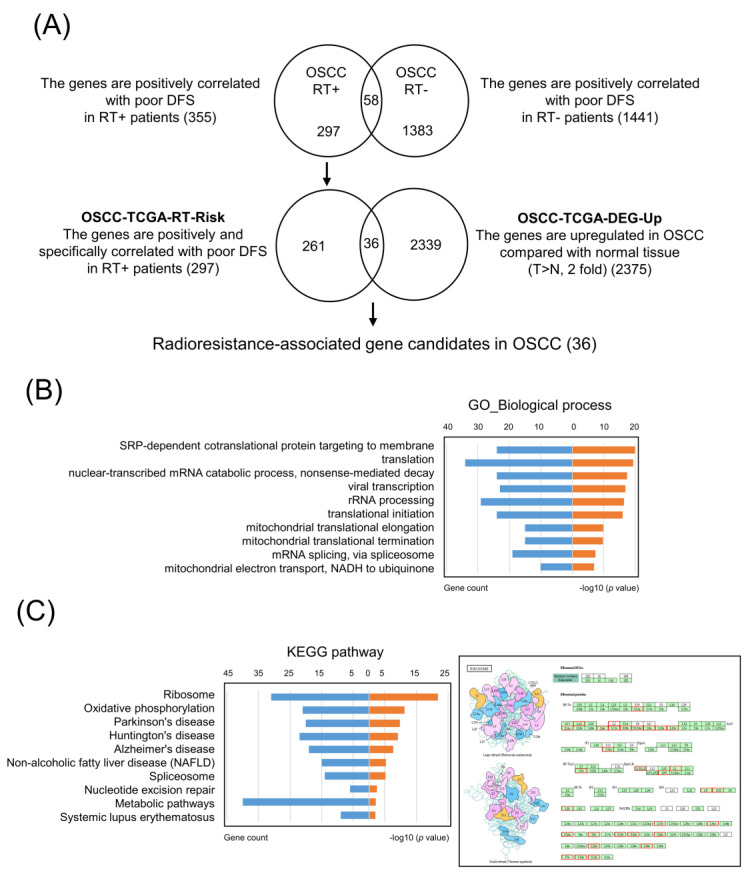
Figure 1.
Identification of specific radioresistance-associated and upregulated gene candidates for OSCC from the TCGA dataset: (A) Schematic diagrams show the workflow design for profiling radioresistance-associated gene candidates in OSCC via comparative analysis of the TCGA dataset. Enrichment analysis of the 297 genes associated with radioresistance in OSCC; (B) significantly enriched GO biological process annotations; (C) significantly enriched KEGG pathways (left). KEGG pathway annotations of the ribosome pathway (right). The nodes indicated in red represent genes with high expression associated with poor DFS.

