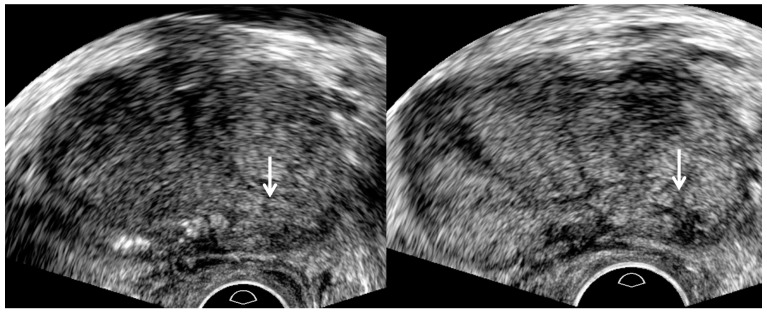
Figure 6.
A 67-year-old man with high PSA (8.29 ng/mL): TRUS image (left figure) prior to biopsy shows an ill-defined lesion (white arrow) in the left base. Another TRUS image (right figure) after sampling two cores shows a well-defined lesion (white arrow) in the same location. The tumor margin becomes clear and spiculate because post-biopsy hemorrhage enhances tumor-to-normal tissue contrast. Accordingly, the relative length of adenocarcinoma with GS 7 (3 + 4) to normal tissue increases as the number of target cores increases.

