Figure 6.
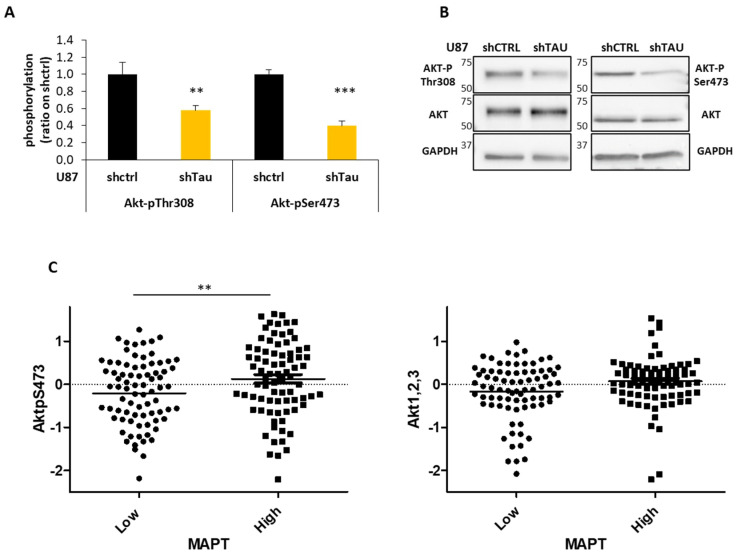
Tau expression correlates with activation of the PI3K-Akt signaling pathway in glioblastoma. (A) Pathscan assay. Quantification of the phosphorylation levels of Akt in total cell lysates; (N = 4, ** p < 0.01, *** p < 0.001 U87shTau versus U87shctrl). (B) Western blot analysis for Akt-pThr308, Akt-pSer473 and total Akt expression in total protein cell lysates (25 µg). GAPDH was used as the loading control. (C) Analysis of the amount of Akt-pSer473 and Akt 1,2,3 total protein from TCGA-GBM Reverse-phase Protein Array (RPPA) dataset. Tumors (N = 158) were stratified into two groups based on Tau (MAPT) RNA expression values below (low) and above (high) the median values (Affymetrix HG-U133A, ** p < 0.01).

