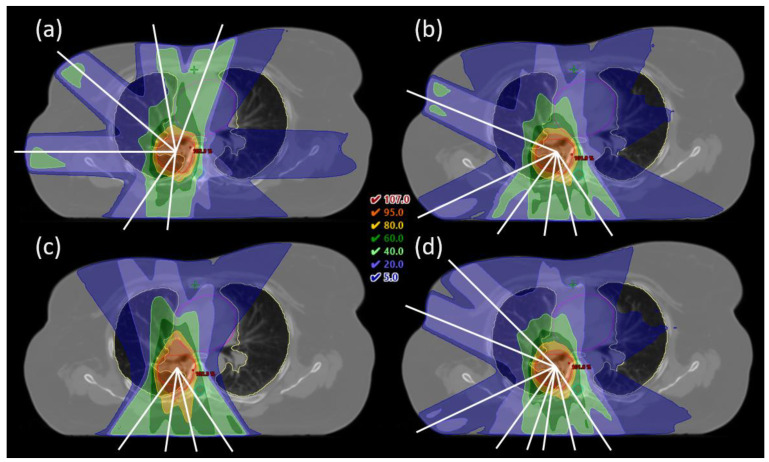
Figure 4.
(a) CLIN plan with manually selected beam angles for patient 1. (b–d) iCE plans with 6, 4 and 8 optimized beam angles for the same patient. Dose is shown relative to the prescribed dose (66 Gy). Contours are the PTV (red), lungs (yellow), heart (magenta), esophagus (grey) and spinal cord (cyan), and beam angles are indicated by white lines.

