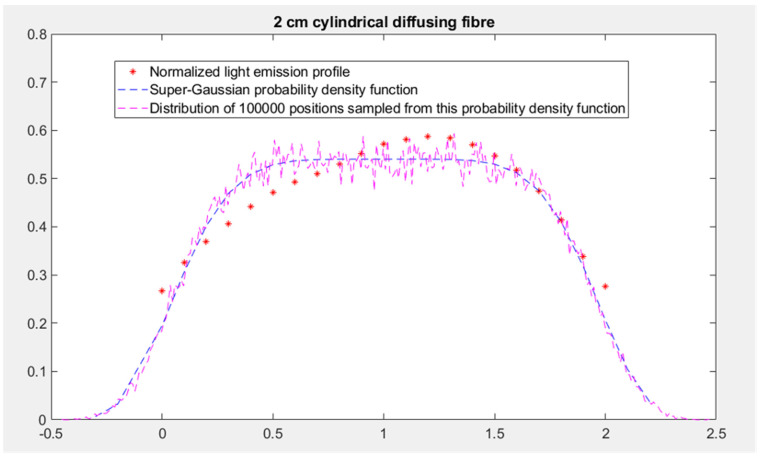
Figure 3.
The light emission profile of the 2 cm cylindrical diffusing fiber (represented by red dots), the associated super-Gaussian probability density function (represented by blue dashes) and the distribution of 100,000 positions sampled from this probability density function (represented by magenta dashes).

