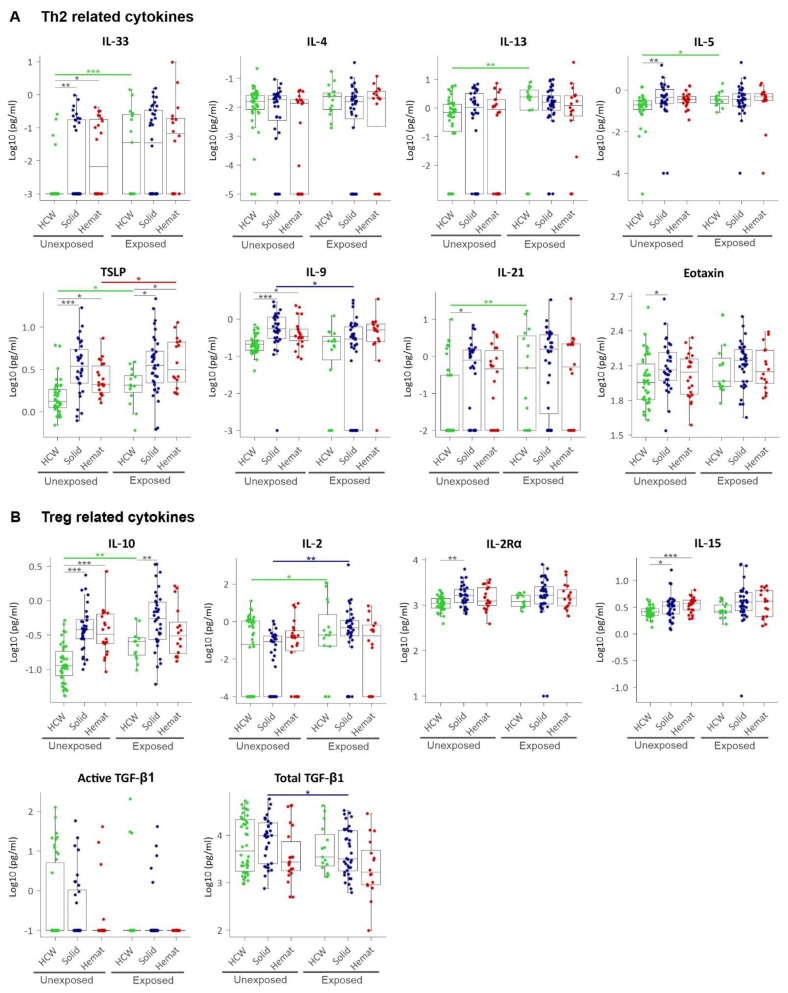
Figure 4.
Plasma levels of (A) Th2 related (anti-inflammatory) cytokines and (B) Treg-related (immunomodulatory) cytokines. HCW, health care workers (green); solid, patients with solid tumours (blue); hemat, patients with haematological malignancies (red). Each dot represents the sample closest to exposure in the case of exposed patients, and an average of multiple timepoints, when available, for unexposed patients. * p < 0.05, ** p < 0.01, *** p < 0.001.

