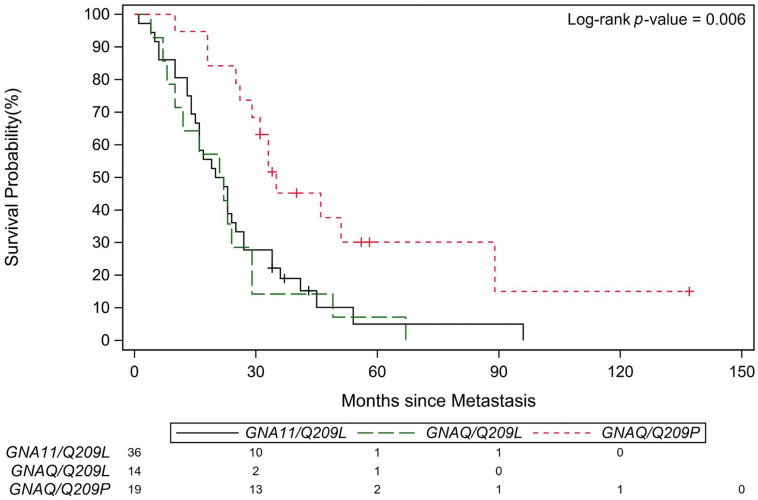
Figure 1.
The Kaplan-Meier Curves for Met-to-Death OS. Kaplan-Meier Curves showing patients carrying tumor mutations with Q209L of GNA11, Q209L of GNAQ and Q209P of GNAQ. The red line represents Q209P of GNAQ (n = 19), the green line represents Q209L of GNAQ (n = 14) and the black line represents Q209L mutation of GNA11 (n = 36).

