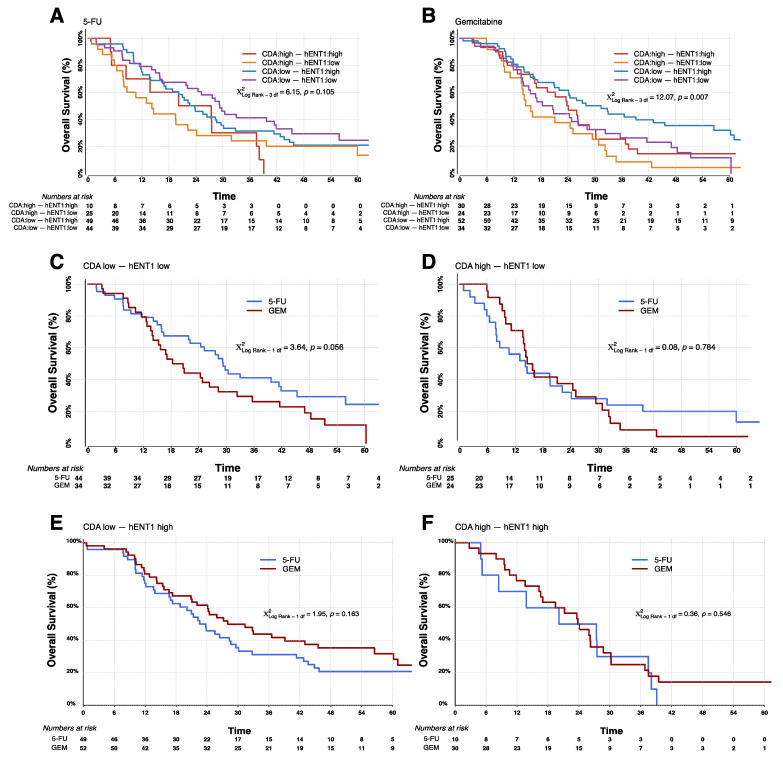
Figure 3.
Kaplan-Meier survival curves for analyses of combined CDA mRNA and hENT1 protein biomarker interaction looking at all expression level combinations (CDA low, hENT1 low; CDA high, hENT1 low; CDA low, hENT1 high; CDA high, hENT1 high). Graphs show response to treatment with 5-FU (A) and gemcitabine (B). In (C,D) the same data as above is presented showing the difference in survival for patients treated with 5-FU compared to gemcitabine in patients with low hENT1 protein and either low CDA (C) or high CDA (D), and patients with high hENT1 protein and either low CDA (E) or high CDA (F). All groups and the number of at-risk individuals are shown for each graph. All p-values were determined by log-rank analyses using two-sided χ2 tests.

