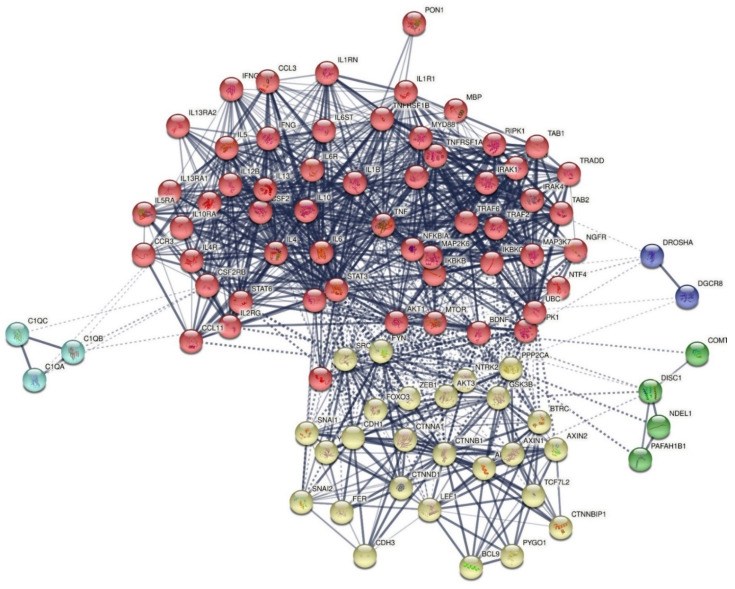
Figure 1.
First order protein network showing 92 nodes and 1063 edges. MCL cluster analysis detected two clusters: (1) a first immune cluster (red color) was centered around BDNF, CCL11, CCL3, CSF2, IFNG, IL10, IL12A, IL13, IL1R1, IL4, IL5, IL6, MBP, PON1, and TNF, and (2) a second adhesion-associated cluster (yellow nodes) was centered around CDH1 and CTNNB1.

