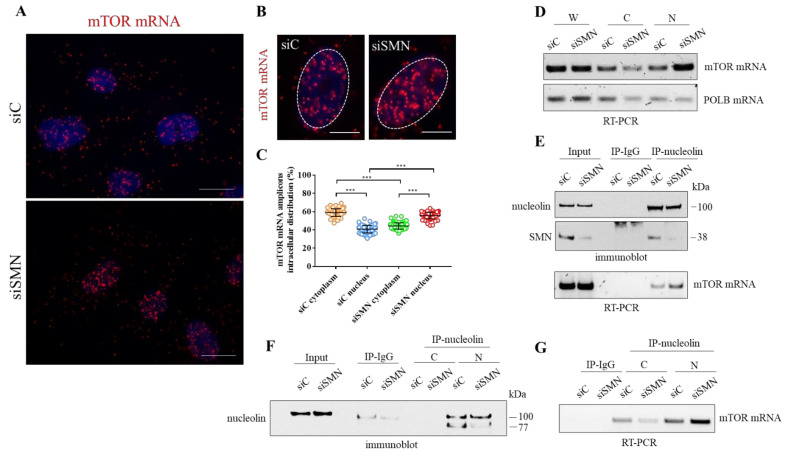
Figure 4.
Subcellular distribution of mTOR mRNA. (A) Representative images of padlock assay targeting mTOR mRNA (red dots), in siC- or siSMN-transfected hTert-Fibroblasts. Nuclei were stained with DAPI. Scale bar 10 µm. (B). Representative images visualizing the nuclear localization of mTOR mRNA (red dots) in siSMN-transfected cells, in comparison with the control (siC). Nuclei were labelled with DAPI. Scale bar 5 µm. (C) Scatterplot showing the percentage of mTOR mRNA amplicons distributed in the cytoplasm or nuclei of the transfected fibroblasts (n = 20 cells were analysed for each condition. In graph are plotted all the results from four independent experiments, *** p < 0.0001 two-way ANOVA–Bonferroni’s multiple comparisons test). Mean ± s.d. are illustrated. (D) Subcellular fractionation of hTert-Fibroblasts. The distribution of mTOR mRNA and DNA Polymerase Beta (POLB) mRNA in different subcellular fractions (W = whole cell extract; C = cytoplasm; N = nucleus) were checked by RT-PCR and analysed by agarose gel electrophoresis. Representative gel of n = 3 independent experiments. (E) Cellular extracts from both the transfected fibroblasts were subjected to RIP assay. Nucleolin monoclonal antibody-conjugated beads or mouse IgG-conjugated beads were used in the immunoprecipitation step. Co-precipitation of nucleolin and SMN are displayed by immunoblotting. The presence of mTOR mRNA in RIP samples was checked by RT-PCR analysed by agarose gel electrophoresis. Representative panels of n = 3 independent experiments. (F,G) Cytoplasmic (C) or nuclear (N) fractions from the transfected fibroblasts were subjected to RIP assay. Nucleolin monoclonal antibody-conjugated beads or mouse IgG-conjugated beads, were used in the immunoprecipitation step. (F) Immunoblotting validating the efficiency of nucleolin immunoprecipitation. (G) The presence of mTOR mRNA in each fraction was checked by RT-PCR analysed by agarose gel electrophoresis. Representative panels of n = 3 independent experiments.

