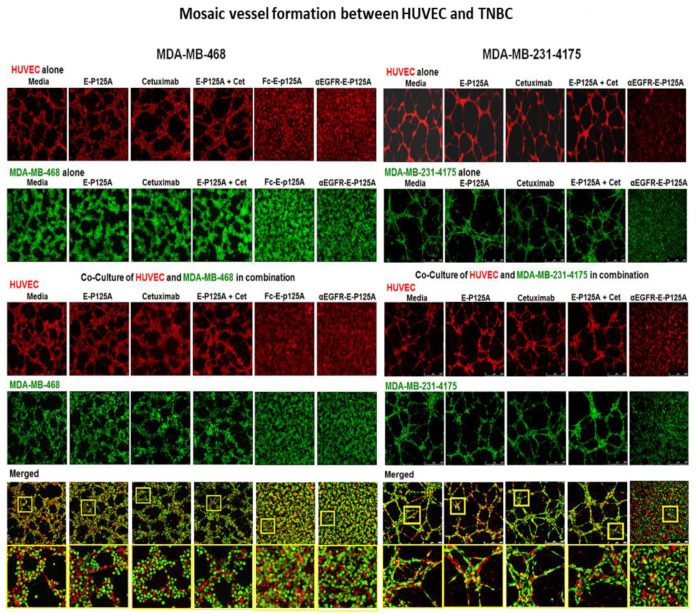
Figure 2.
αEGFR-E-P125A inhibition of ‘mosaic’ vessel formation: HUVEC and TNBC co-culture. Left Panel HUVECs labeled with CellTracker™ Red CMTPX and MDA-MB-468 with CellTracker™ Green CMFDA. HUVECs (left panel, top row) in serum-free EBM2 or MDA-MB-468 (left panel, second row) in serum-free RPMI cultured alone on matrigel for 16 as indicated: αEGFR-E-P125A, or controls (media, E-P125A, cetuximab, or the combination of E-P125A and cetuximab (E-P125A + Cet)). MDA-MB-468 and HUVEC in serum-free EBM2 and RPMI co-cultured on matrigel for 16 h with indicated treatment (Left panel bottom four rows). Fluorescent imaging is shown for HUVEC (red), MDA-MB-468 (green), or both (merged). Right Panel: HUVEC and MDA-MB-231-4175 co-culture (HUVEC labeled with CellTrace™ Calcein Red-Orange AM (red) or MDA-MB-231-4175 labeled with CellTrace™ calcein green AM (green) were cultured separately on matrigel for 16 h and treated with αEGFR-E-P125A or controls [media, E-P125A, cetuximab, or E-P125A and cetuximab combined (E-P125A + Cet)]. (Right panel, top two rows). Labeled MDA-MB-231-4175 and HUVEC cocultured on matrigel (Rightpanel, bottom 4 rows). Labelled MDA-MB-231-4175 and HUVEC co-cultured on matrigel 16 h and treated as indicated Images taken with a Leica fluorescence confocal microscope. (Left and Right bottom panels): Higher magnification views are provided of areas highlighted in yellow bordered squares below the coculture figures in the, demonstrating the alignment and coalescence of HUVEC (red) and TNBC cells (green) in mosaic vessels, as well as the more random distribution of HUVEC and TNBC in cocultures exposed to αEGFR-E-P125A.

