Figure 4.
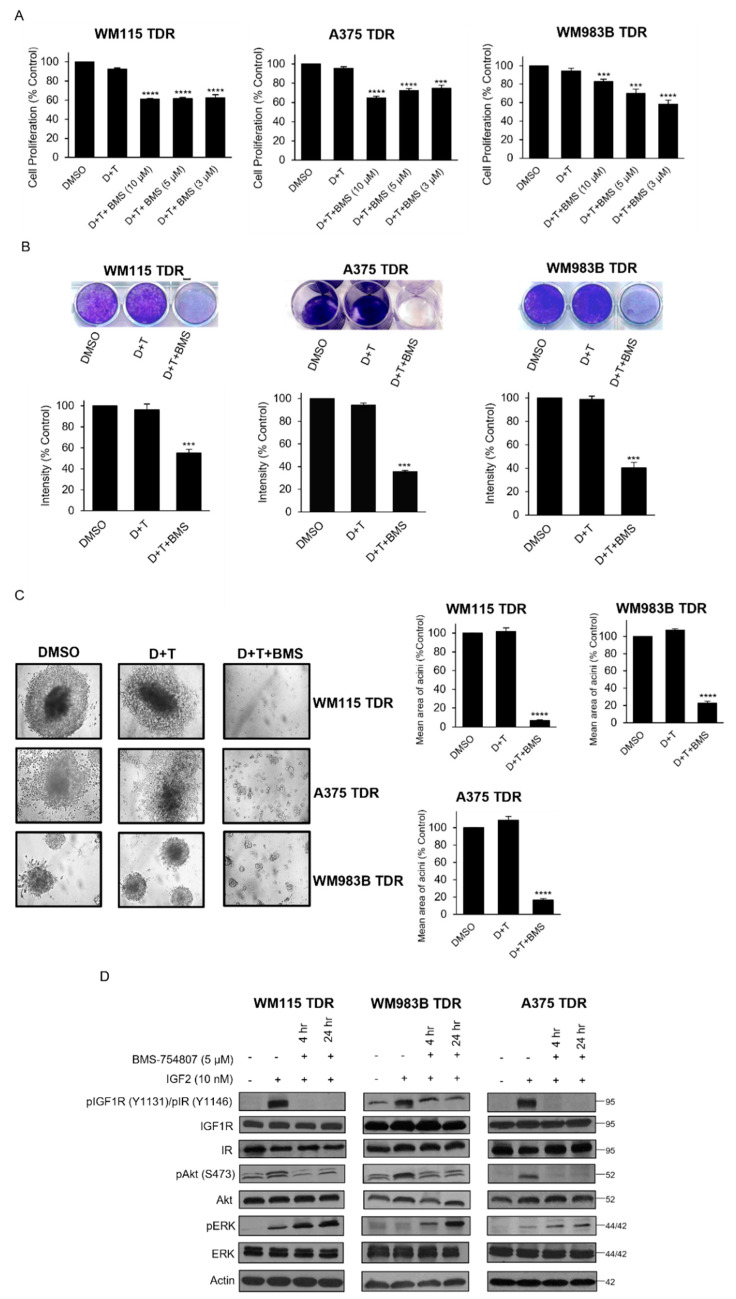
BMS-754807 in combination with dabrafenib and trametinib inhibits cell proliferation and inhibits intracellular Akt (A) TDR cells (WM115, WM983B, and A375) plated for 24 h and treated with DMSO, dabrafenib (D), and trametinib (T) (WM115: D: 800 nM, T: 200 nM; WM983B: D: 2.4 µM, T: 500 nM; A375: D: 250 nM, T: 12.5 nM) treated alone or in combination with BMS-754807 (3, 5, and 10 µM) and treated with MTT. The intensities are represented as mean. Error bars: SEM *** p < 0.001; **** p < 0.0001 by two-tailed Student’s t-test compared to DMSO group. (B) TDR cells were plated and treated with media containing DMSO, dabrafenib (D) and tramatenib (T) (WM115: D: 800 nM, T: 200 nM; WM983B: D: 2.4 µM, T: 500 nM; A375: D: 250 nM, T: 12.5 nM), or BMS-754807 (5 µM) in combination with dabrafenib and trametinib (D + T + BMS). Media containing drugs were replenished every second day and stained with 0.5% crystal violet on Day 21. Representative images of the well for each treatment (Top panel). Quantification of intensities (Bottom panel) for the wells is represented as mean. Error bars: SEM (n = 2 independent experiments performed in triplicates). *** p < 0.001 by two-tailed Student’s t-test compared to DMSO group. (C) TDR cells were seeded on matrigel basement membrane and treated with indicated drugs every second day. Pictures of each well were captured on day 21 (left panel) at 10× magnification. Quantification of mean area of acini (right panel). **** p < 0.0001 by two-tailed Student’s t-test compared to DMSO group. (D) TDR cells were serum starved for 24 h and treated with BMS-754807 (5 µM) along with dabrafenib (D) and trametinib (T) (WM115 TDR: D: 800 nM, T: 200 nM; WM983B TDR: D: 2.4 µM, T: 500 nM; A375 TDR: D: 250 nM, T: 12.5 nM) for 4 or 24 h followed by IGF2 (10 nM) stimulation for 1 h. Whole cell lysates were analyzed by Western blot using indicated antibodies. Actin was used as loading control.

