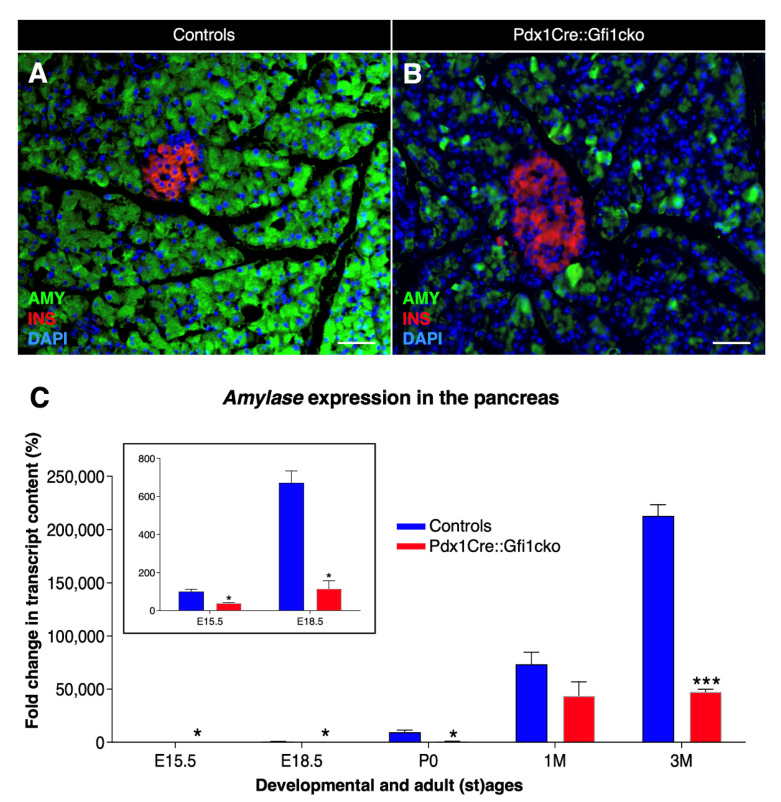
Figure 3.
Important decrease in amylase expression in Pdx1Cre::Gfi1cko animals. Immunohistochemical analyses of Pdx1Cre::Gfi1cko and control mice using antibodies recognizing insulin (red) amylase (green) and DAPI (blue). Objective magnification: 20×. Scale bar: 50 μm (A,B). Amylase expression levels were assessed by RT-qPCR at different developmental and adult ages. Insert graph shows amylase expression at E15.5 and E18.5 of both Gfi1-conditional knockouts and controls. (n = 5 animals per genotype per (st) age) (* p < 0.05, *** p < 0.001) (C).

