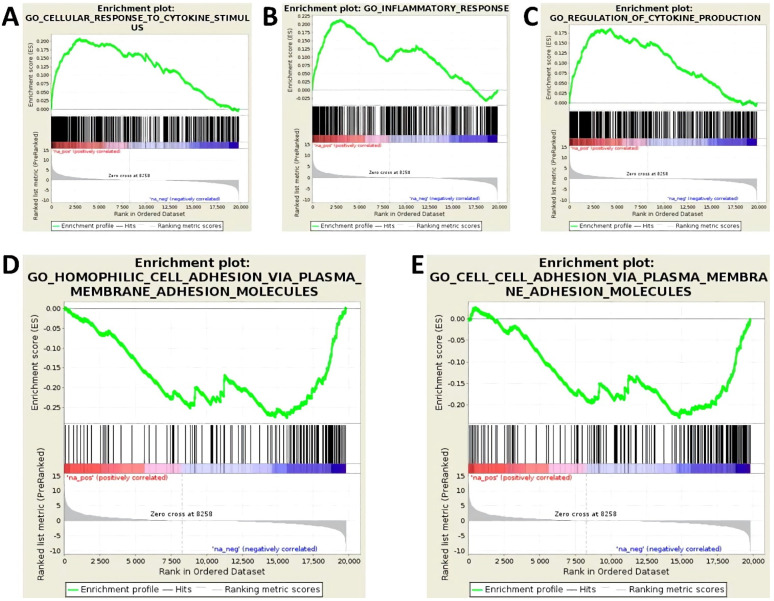
Figure 1.
Human endothelial cells (cell line TIME, ATCC® number CRL-4025) were evaluated following stimulation with 5 ng/mL each of IL-1β, TNF-α, and IFN-γ for 24 h and compared to untreated controls. Three biological replicates were tested in each group. Transcriptome data obtained by next generation sequencing (NGS) were gathered into a gene set enrichment analysis (GSEA). Shown are 5 enrichment plots, which correspond to defined gene sets. (A) GO-Cellular-Response-To-Cytokine-Stimulation, (B) GO-Inflammatory-Response, (C) GO-Regulation-Of-Cytokine-Production, (D) GO-Homophilic-Cell-Adhesion-Via-Plasma-Membrane-Adhesion-Molecules, (E) GO-Cell-Adhesion-Via-Plasma-Membrane-Adhesion-Molecules. Each plot shows the running Enrichment score (ES) for the gene set, which reflects the degree to which a gene set is over-represented at the top or bottom of a ranked list of genes. A positive ES indicates gene set enrichment at the top of the ranked list (=upregulation); a negative ES indicates gene set enrichment at the bottom of the ranked list (=downregulation).

