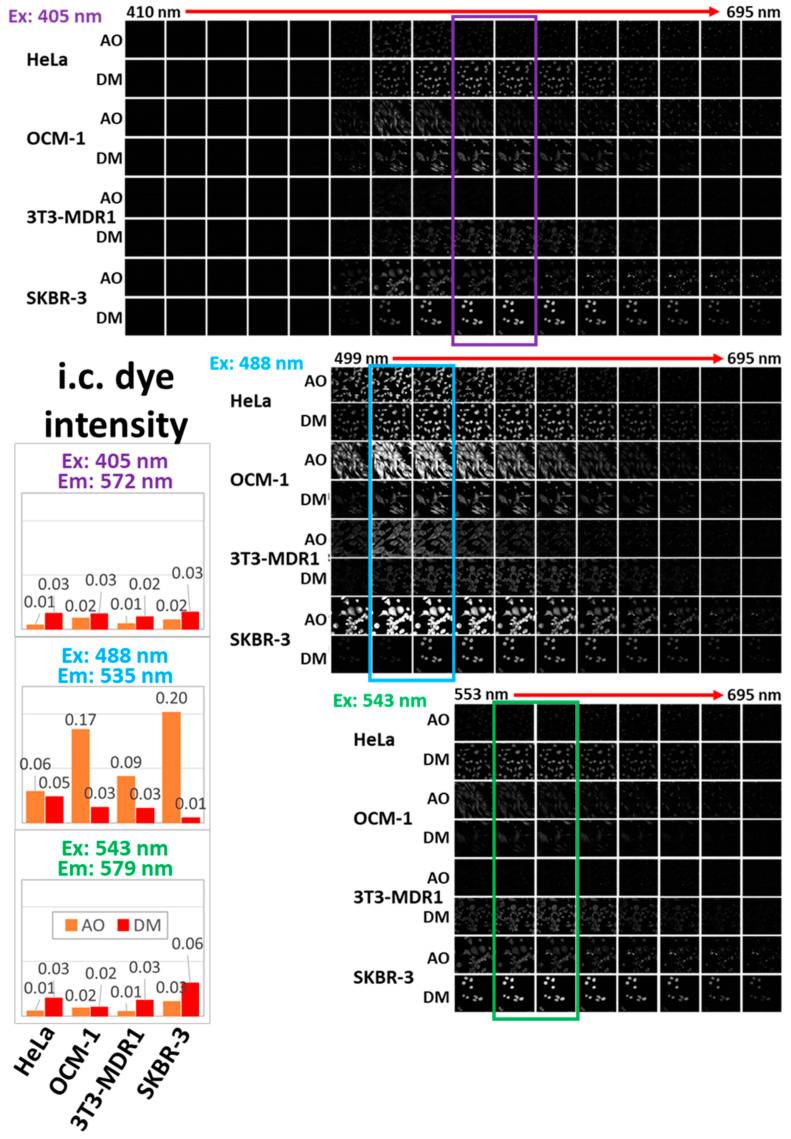
Figure 3.
Spectral imaging of fluorescently labeled HeLa, OCM-1, 3T3-MDR1, and SKBR-3 cells. Differences in UV-Vis absorption and fluorescence emission between the two dyes in the presence of cells are illustrated using spectral imaging. Laser excitations at 405, 488, or 543 nm were used to capture images of the three panels from top to bottom. The fluorescence emission spectrum of the three panels from top to bottom contained 16, 11, or 8 pieces of 18-nm bands spanning the emission ranges of 410 to 695, 499 to 695, or 543 to 695 nm. The bar chart shows the relative intracellular dye intensities of the AO and DM at their maximum emission intensities (572 ± 18, 535 ± 18, 579 ± 18 nm) according to the spectral imaging at the three different laser excitations (405, 488, 543 nm), respectively. The intensities were determined using the Gel plugin of the Fiji software by measuring the total area under the curve of the cell intensity profile of images. One representative image series of three similar experiments is displayed in this figure.

