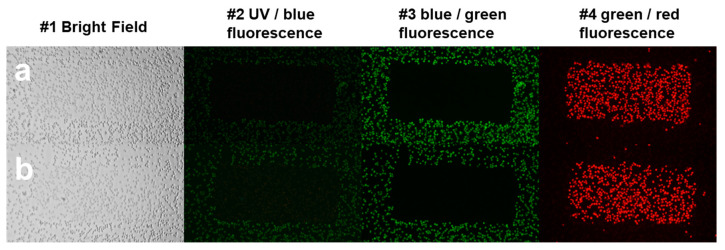
Figure 4.
Phototoxicity measurements of HeLa cells labeled with AO or DM. Localized phototoxicity was induced in HeLa cells applying 488-nm laser light illumination. In columns #3 and #4 we can easily distinguish live cells appearing as green (AO or DM staining) from cells targeted to phototoxic death appearing in red (PI staining). The cells were illuminated in 63 cycles in the presence of 2.5 µM AO (a, top row images) or DM (b, bottom row images) and propidium iodide in both cases with an iCys LSC system. Adherent cells were maintained under physiological conditions during the approximately five-hour procedure. Then, conventional bright-field and epifluorescence microscopic images of the LSC-illuminated area were recorded. Column #1: bright field of view, column #2: UV/blue fluorescence, column #3: blue/green fluorescence and column #4: green/red fluorescence images (excitation light/emission light). A detailed explanation of the experimental setup is described in the caption to Figure 5, and the materials and methods.

