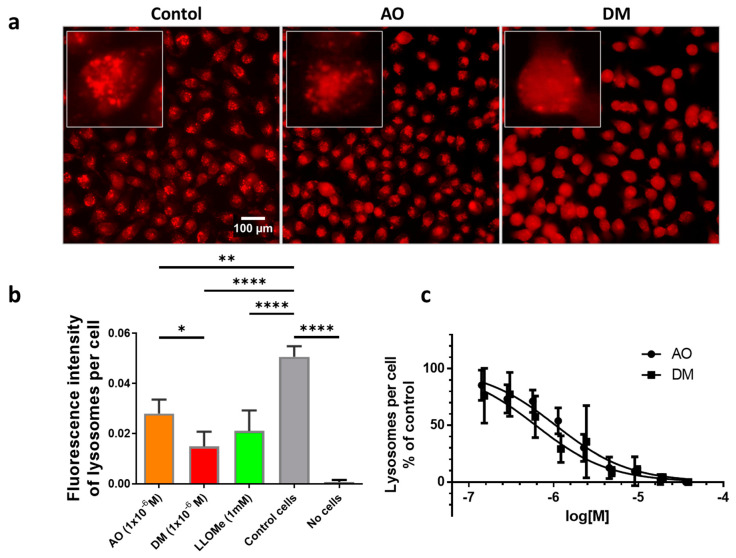
Figure 8.
DM causes more significant photodynamic lysosomal damage than AO. The integrity of the lysosomes was examined with LysoOrange dye in HeLa cells. Panel (a): Under control conditions (leftmost image), LysoOrange stains many lysosomes around the nucleus with high intensity and contrast, while the cytoplasmic background intensity is low. With blue light illumination after AO and DM pretreatment, fewer lysosomes are stained with the LysoOrange. However, DM has a higher cytoplasmic background intensity (rightmost image) than AO (middle image). In each of the overview images having a low magnification, a representative cell of the sample can be seen magnified. The inserts represent 80·80 µm2 in size. Panel (b): Image analysis was applied to determine the average fluorescence intensity of the LysoOrange dye in single cells. This average is proportional to the lysosome content of cells. During the DM treatment, significantly fewer intact lysosomes remained in the cells than during AO treatment (p = 0.02). LLOMe, a known photodynamic lysosomal damaging compound, was used as the positive control. Panel (c): The photodynamic dose-response curves of AO and DM were determined by image analysis of the lysosome integrity. The half-effective dose was 1.1 µM for AO, while 0.6 µM for DM. The statistical comparison of fits indicated a significant difference (p = 0.0003) between curves; (*: p < 0.05, **: p < 0.01, ****: p < 0.001). One representative data set out of three experiments is displayed. Details of the image analysis can be found in the supplementary materials.

