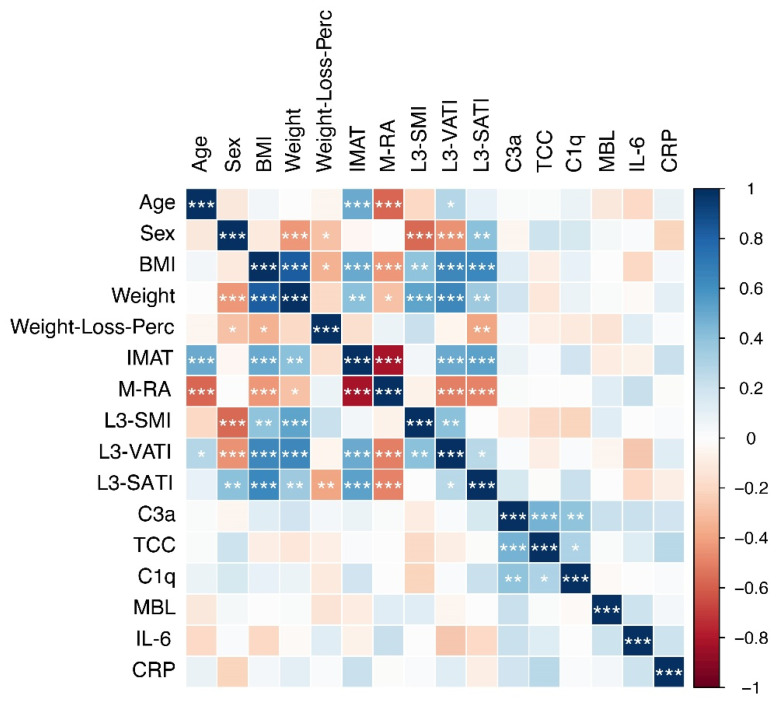
Figure 3.
Correlation plot showing Spearman correlations between indicated cachexia-related variables and complement factors. Positive correlations are shown in blue, negative correlations in red. The color intensity indicates the strength of the correlation. The asterisks indicate the level of statistical significance (* p ≤ 0.05, ** p ≤ 0.01, *** p ≤ 0.001).

