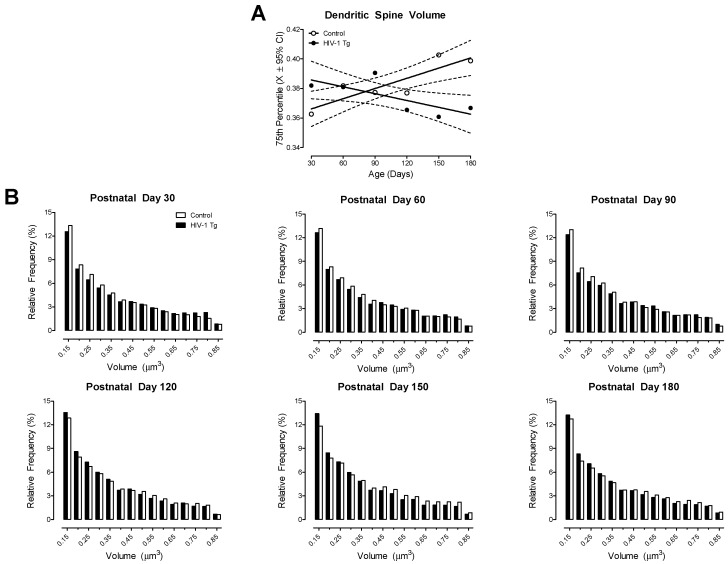
Figure 5.
HIV-1 Tg animals exhibited a progressive decrease in dendritic spine volume. (A) The 75th percentile of dendritic spine volume was derived from the distribution of dendritic spines (X ± 95% confidence intervals). HIV-1 Tg animals exhibited a linear decrease in dendritic spine volume across development, whereas control animals displayed an age-related linear increase in dendritic spine volume. (B) Examination of the distribution of dendritic spine volume in HIV-1 Tg and control animals as a function of age confirmed the observations inferred from the 75th percentile of dendritic spine volume.

