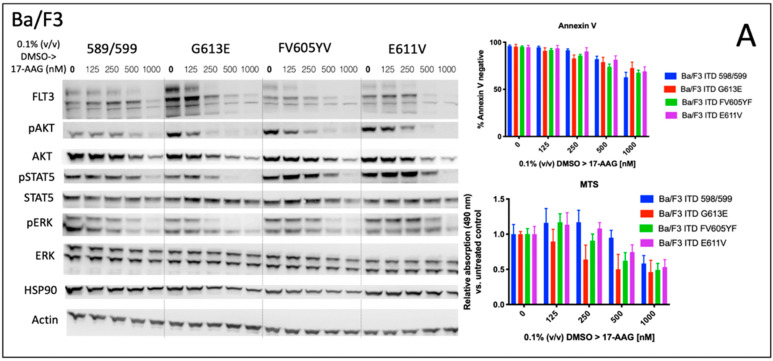
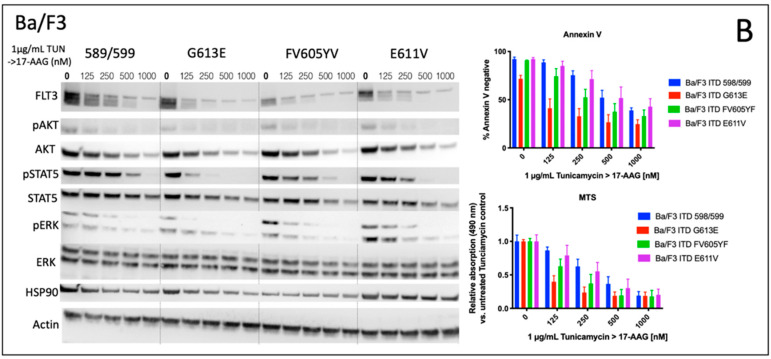
Figure 1.
Signal transduction, metabolic activity, and apoptosis after treatment of Ba/F3 cell lines expressing four distinct FLT3-ITD variants with 17-AAG after pre-incubation with tunicamycin. Immunoblotting analysis of signaling pathways (left) after sequential incubation of four Ba/F3 cell lines stably expressing different FLT3-ITD variants with 1 μg/mL tunicamycin and 17-AAG. (A) Ba/F3 cells were incubated with 0.1% (v/v) DMSO for 24 h followed by treatment with 17-AAG at the indicated concentrations for 24 h. (B) the incubation was started with 1 μg/mL tunicamycin for 24 h prior to treatment with 17-AAG at indicated concentrations for a further 24 h. Whole cell protein lysates were subjected to SDS-PAGE and immunoblotting to assess the expression and phosphorylation status of the signaling proteins. For loading control, the levels of beta-Actin were detected. Representative blots of the three independent experiments are shown. Corresponding assays indicating metabolic activity (MTS) and apoptosis (Annexin V) are illustrated in the right section of all Ba/F3 FLT3-ITD cell lines. The data for MTS assays are shown as relative absorption compared to untreated controls. Apoptosis is demonstrated by Annexin V-negative cells indicating viable, non-apoptotic Ba/F3 cells. Graphs are shown as the mean ± SD that were obtained from three independent experiments. Statistical significance between each Ba/F3 cell lines comparing DMSO vs. tunicamycin group was calculated using paired t-tests. p values of Student’s t-test, raw data, as well as IC50 values are shown in Table S1 in the Supplement.


