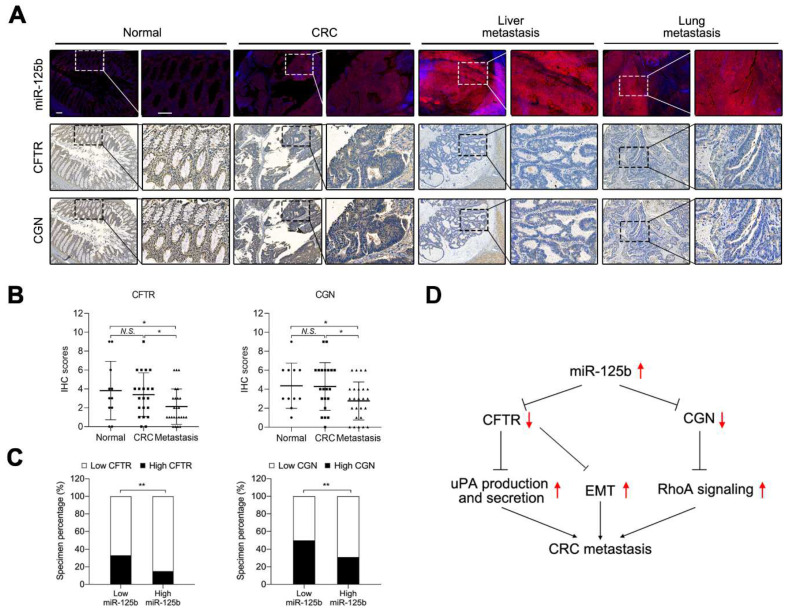
Figure 8.
miR-125b is negatively correlated with CFTR and CGN in CRC. (A) Representative images of serial sections indicate an inverse relationship between miR-125b and both CFTR and CGN. Magnified views of the regions indicated by the boxed area are shown below. Scale bars represent 200 μm (up) and 100 μm (down). (B) CFTR and CGN levels were decreased in metastasis compared with normal and CRC tissues. Left: p = 0.6545 (Normal vs. CRC); p = 0.0494 (Normal vs. Metastasis) p = 0.0472 (CRC vs. Metastasis); Right: p = 0.9330 (Normal vs. CRC); p = 0.0443 (Normal vs. Metastasis) p = 0.0269 (CRC vs. Metastasis). (C) The association between miR-125b expression and CFTR and CGN levels in CRC specimens. * p < 0.05, ** p < 0.01 by Wilcoxon signed rank test in (B) and by Chi-square test in (C). (D) A picture summary of our results.

