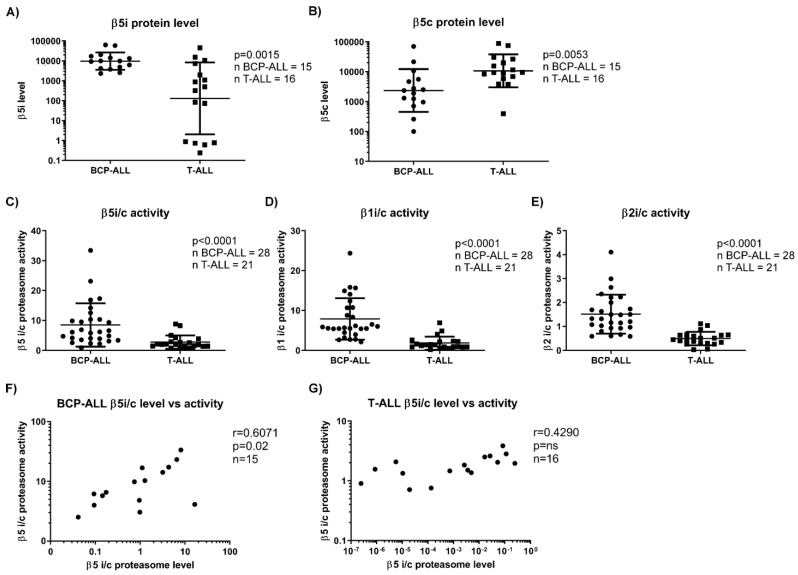
Figure 1.
Expression levels and activity of the immunoproteasome vs. constitutive proteasome in BCP-ALL and T-ALL. (A) Comparison of levels of the constitutive proteasome β5 subunit (β5c) between BCP-ALL and T-ALL samples. Data represent geometric mean ± SD. p was obtained with Mann–Whitney U test. (B) Comparison of levels of the immunoproteasome β5 subunit (β5i) between BCP-ALL and T-ALL samples. Data represent geometric mean ± SD. p was obtained with Mann–Whitney U test. (C) Comparison between the ratio of activity of proteasome β5i versus β5c. Data represent mean ± SD. p was obtained with Mann–Whitney U test. (D) Comparison between the ratio of activity of proteasome β1i versus β1c. Data represent mean ± SD. p was obtained with Mann–Whitney U test. (E) Comparison between the ratio of activity of proteasome β2i versus β2c. Data represent mean ± SD. p was obtained with Mann–Whitney U test. (F) Correlation between the ratio of activity of proteasome β5i versus β5c subunits and the ratio of expression levels of proteasome β5i versus β5c subunits in BCP-ALL samples. r and p were obtained with Spearman’s correlation. (G) Correlation between the ratio of activity of proteasome β5i versus β5c subunits and the ratio of expression levels of proteasome β5i versus β5c subunits in T-ALL samples. r and p were obtained with Spearman’s correlation. BCP-ALL = B-cell precursor acute lymphoblastic leukemia, T-ALL = T-lineage acute lymphoblastic leukemia, i = immunoproteasome, c = constitutive proteasome.

