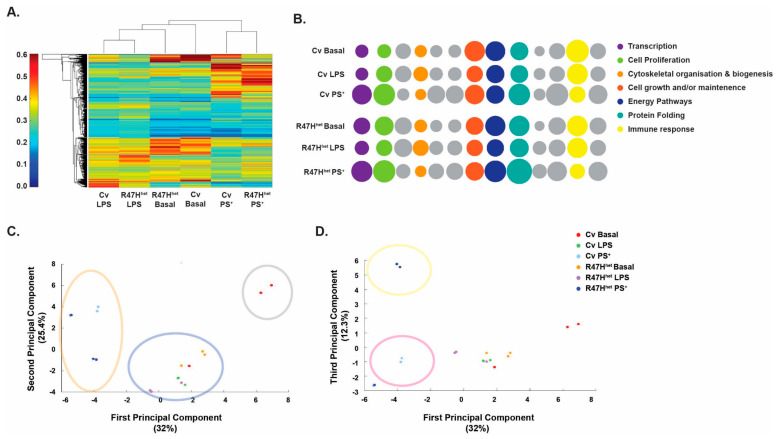
Figure 1.
Following treatment, exosomes fell into specific clusters. Following the LC-MS/MS process, a heatmap of the exosomal proteins was constructed to analyse the effect of the different iPS-Mg treatments on exosomal proteome content (A). The relative abundance of proteins associated with different biological processes, identified with FunRich, was plotted for the different conditions, with the diameter of the circles representing protein abundance (B). Principal component analysis (PCA) was used to find clusters between the different samples (C,D). N = 3 independent samples analysed by LC-MS/MS for each condition.

