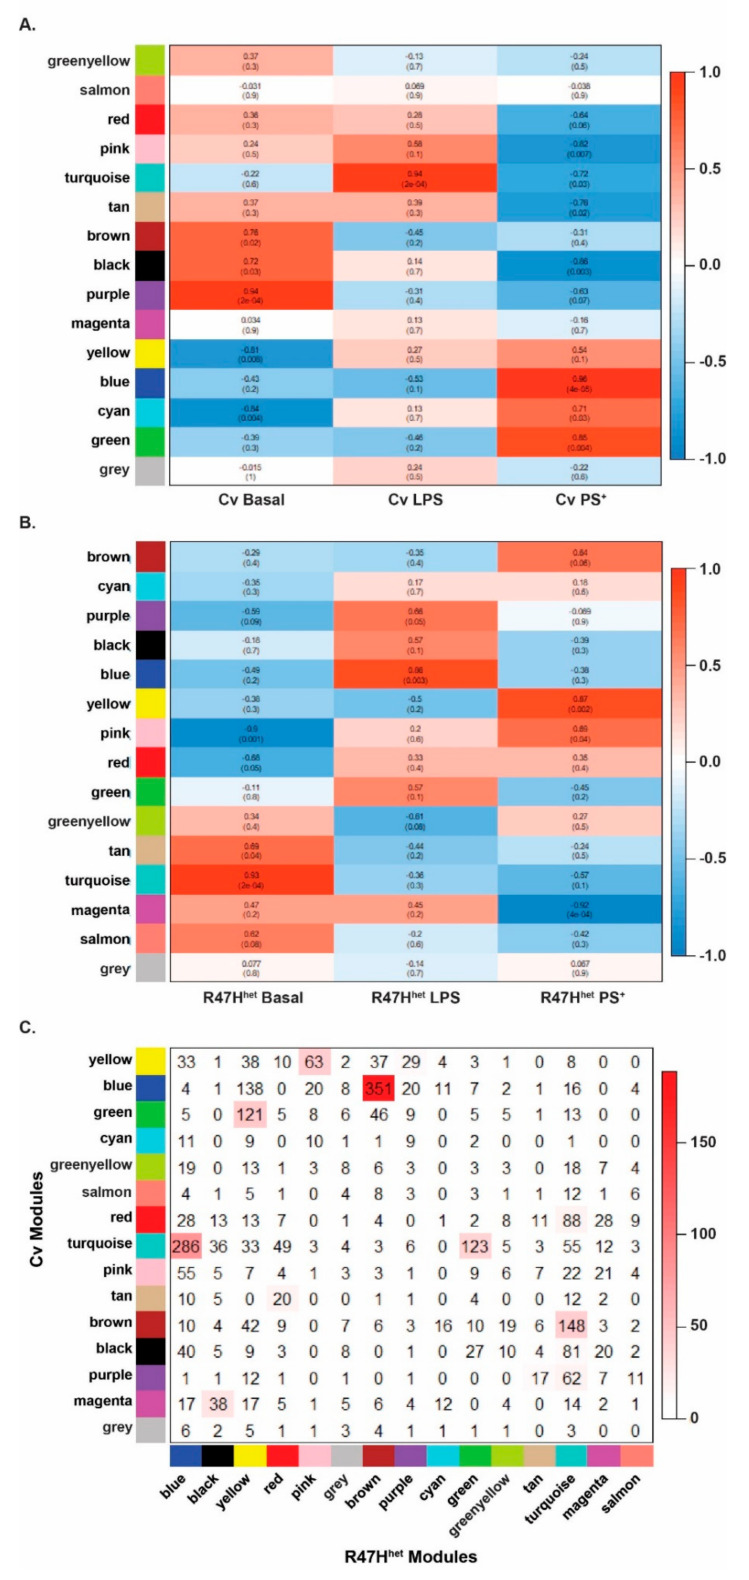
Figure 3.
Network analysis. Based on the constructed networks, the relationship between the different iPS-Mg treatments and the identified modules was plotted. The treatment–module relationships are shown for the Cv network (A) and the R47Hhet network (B). The correlations are indicated in the boxes with the p values in parentheses. The direction of the correlation was colour-coded, with positive correlations indicated in red and negative correlations in blue. The overlap between the modules identified in the Cv and R47Hhet network was also plotted (C), with the number of shared proteins represented in the boxes and the –log (p value) indicated by the colouring. N = 3 independent samples analysed by LC-MS/MS for each condition.

