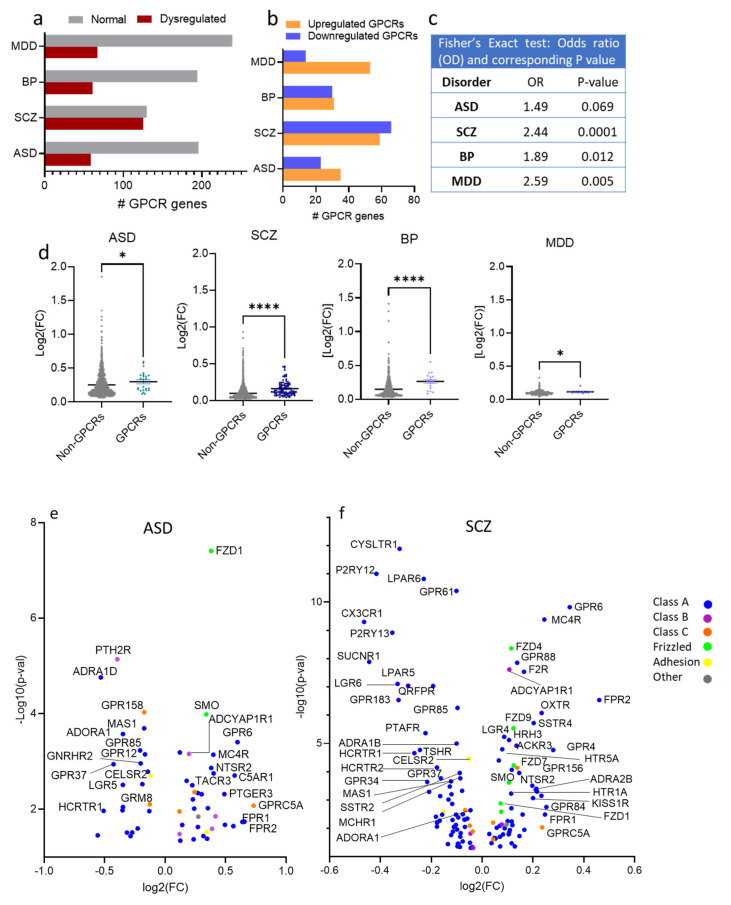
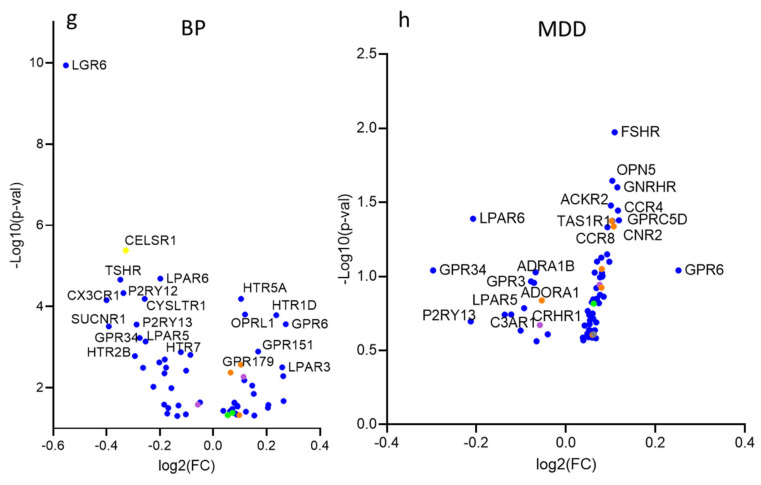
Figure 2.
Differential expression of GPCR genes in SCZ, ASD, BP, and MDD; (a) Histogram of the distribution of differentially expressed (DE) and non-DE GPCR genes frequencies in ASD, SCZ, BP, and MDD. (b) Histogram of the frequency distributions of upregulated and downregulated GPCR genes in the ASD, SCZ, BP, and MDD. (c) Fisher’s exact test for the overrepresentation of GPCR genes in the transcriptomes of ASD, SCZ, BP, and MDD. (d) Scatter dot plot representing the magnitudes of differential expressions determined by average absolute fold-change of GPCRs and non-GPCRs in ASD, SCZ, BP, and MDD, Mann–Whitney U, P = 0.032, <0.0001, <0.0001, =0.03 in ASD, SCZ, BP, and MDD, respectively * P < 0.05, **** P < 0.0001. (e–h) Volcano plots of cilia DEGs in (e) ASD, (f) SCZ, (g) BP, and (h) MDD.


