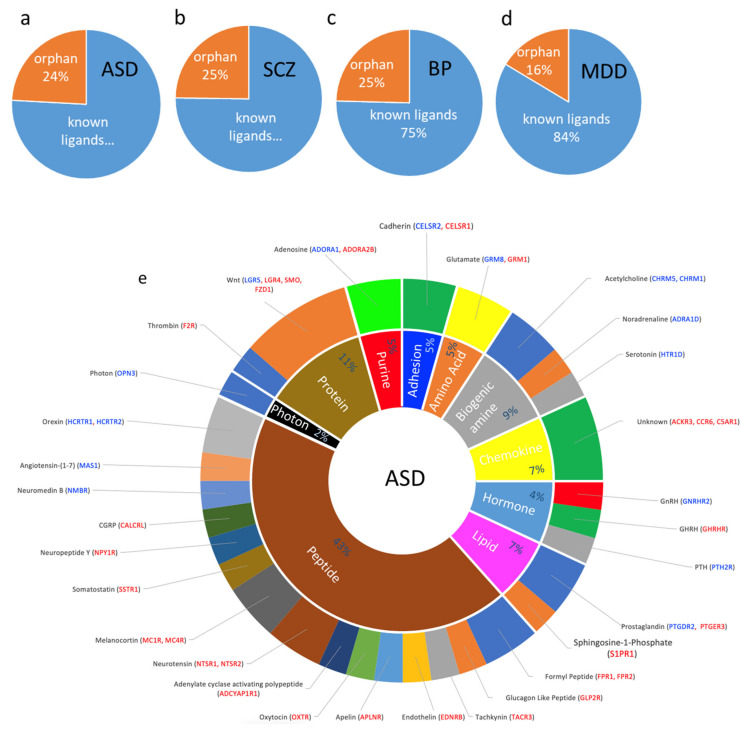
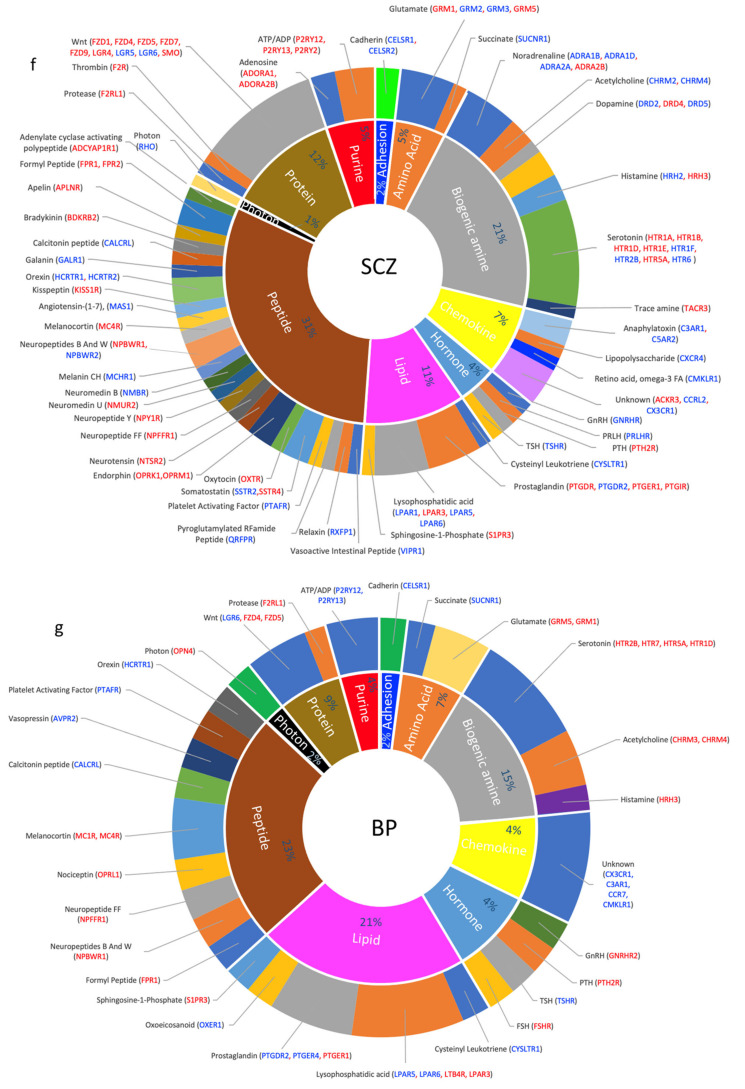
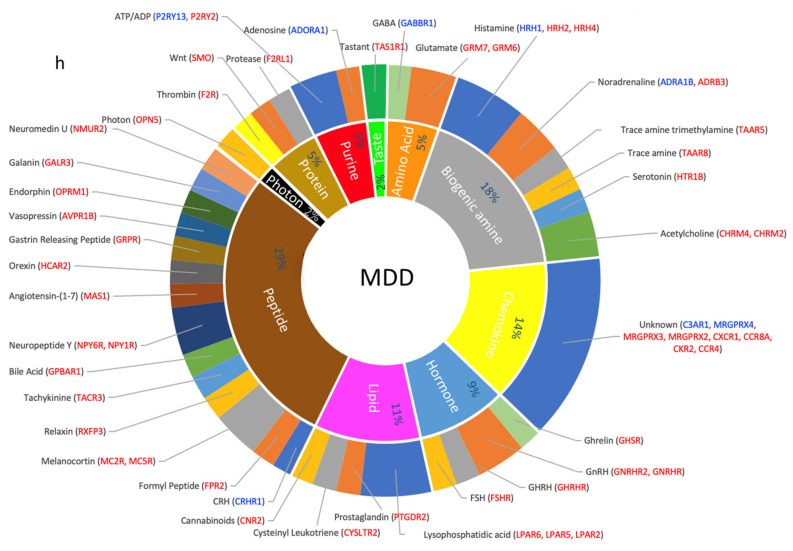
Figure 4.
Dysregulated GPCR classifications based on their ligands; (a–d) Pie chart showing the percentage of DEs belonging to an orphan or non-orphan GPCR as proportions of their corresponding total GPCR DEs in (a) ASD, (b) SCZ, (c) BP, and (d) MDD. (e–h) Doughnut chart showing the percentage of major classes of ligated GPCR DEs in the inner ring and the ligands that activate the GPCR DEs in the outer ring. Differentially expressed GPCRs are shown in blue: downregulated and red: upregulated.


