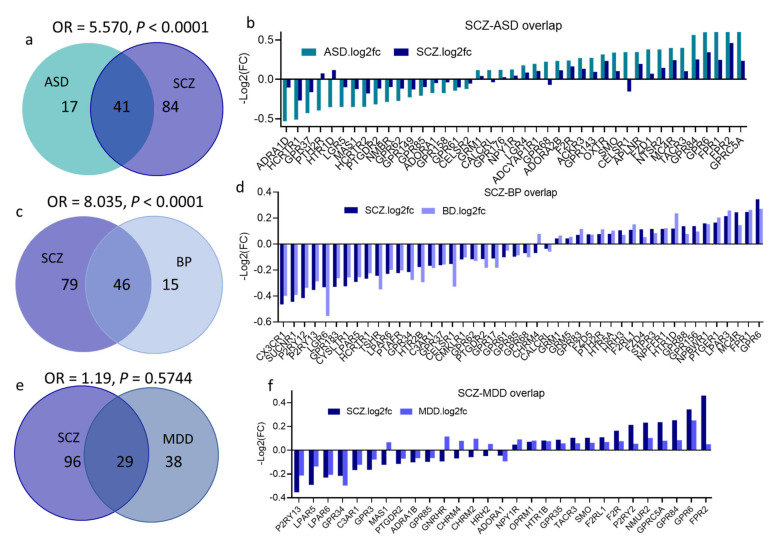
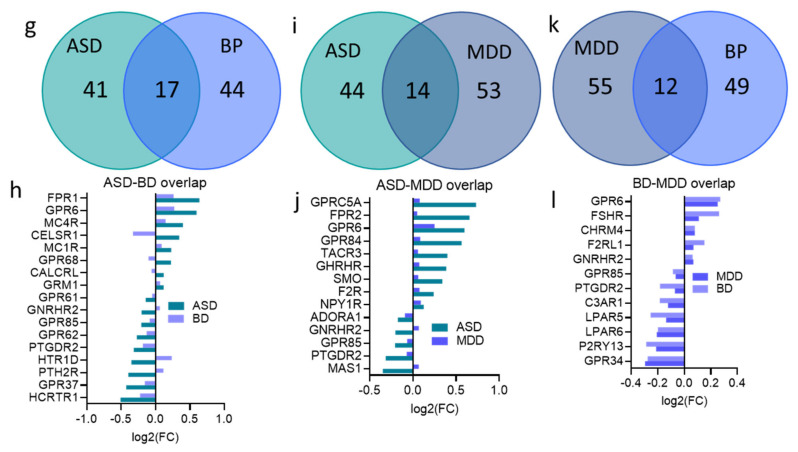
Figure 5.
GPCRs’ DEGs overlap across the four psychiatric disorders; (a,c,e,g,i,k) Venn diagram conveying overlap between significant DEGs (P < 0.05) in (a) SCZ and ASD, (c) SCZ and BP, (e) SCZ and MDD, (g) ASD and BP, (i) ASD and MDD, (k) MDD and BP. Fisher’s test results are shown (OR and P values for each overlap). (b,d,f,h,j,l) GPCR DEGs overlapping between (b) SCZ and ASD, (d) SCZ and BP, (f) SCZ and MDD, (h) ASD and BP, (j) ASD and MDD, (l) MDD and BP.


