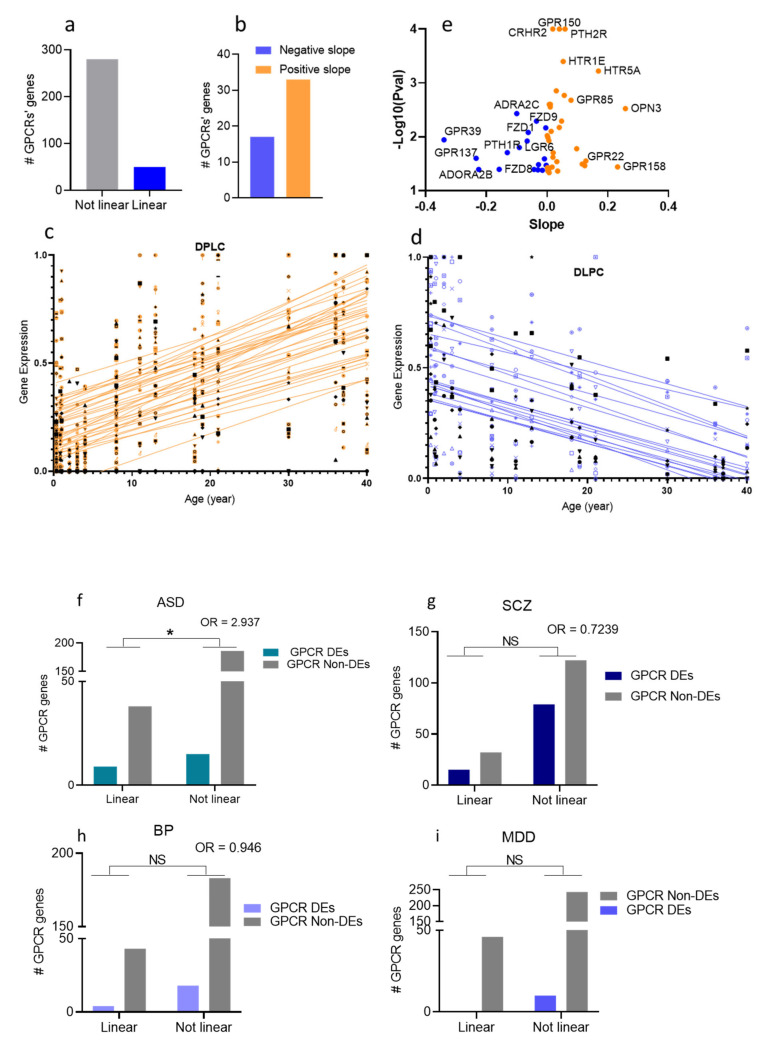
Figure 6.
Age-dependent gene expressions of GPCRs in the human prefrontal cortex (DLPC). (a) Bar chart showing the numbers of GPCR genes that follow linear regression in the DLPC (b) Bar chart showing the numbers of upregulated GPCRs (positive slope) and downregulated (negative slope) with chronological age. (c,d) Scatter plots and fitted linear regression lines of GPCRs that were differentially expressed with age: upregulated (c) and downregulated (d) GPCRs with chronological age. (e) Volcano plot of regression coefficient and p-values in DLPC. The x-axis represents the age effect on GPCR expression measured by regression coefficient. The y-axis represents the -log10(P-value). The orange dots represent age-dependent upregulated GPCRs, and the blue dots represent age-dependent downregulated GPCRs. (f) Bar graph representation of the correlation between age-dependent expressions of GPCR and their dysregulations in (f) ASD, (g) SCZ, (h) bp, and (i) MDD (Fisher’s exact test shows the significant correlation in ASD, P = 0.02, * P < 0.05).

