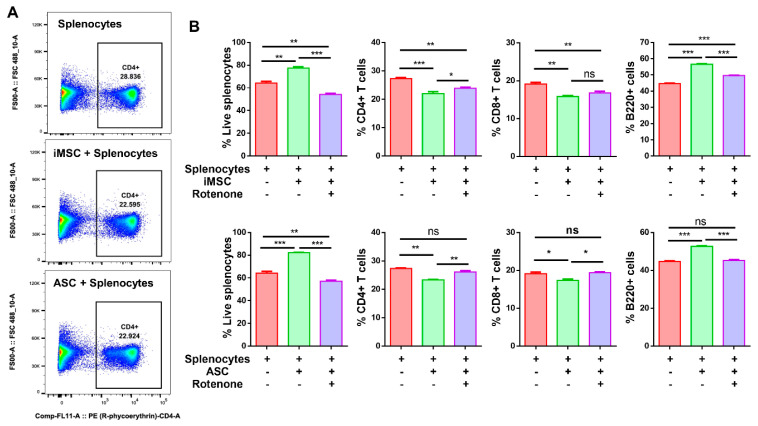
Figure 4.
Both iMSC and ASC suppress effector T cell population. (A) Representative flow cytometry dot plots showing decreased CD4+ T cells in iMSC-splenocytes and ASC-splenocytes coculture compared to monoculture. (B) Quantification data represented as bar graphs after flow cytometry analysis of live cells, CD4+ T cells, CD8+ T cells, and B220+ cells in mouse splenocytes monocultures and cocultures with iMSC, ASC, as well as iMSC, and ASC pretreated with rotenone (500 nm, 2 h) at 1:10 (iMSC/ASC and splenocytes) ratio. Data shown as mean ± SEM from a single experiment repeated independently with similar results (* p < 0.01, ** p < 0.001, *** p < 0.0001 one-way ANOVA).

