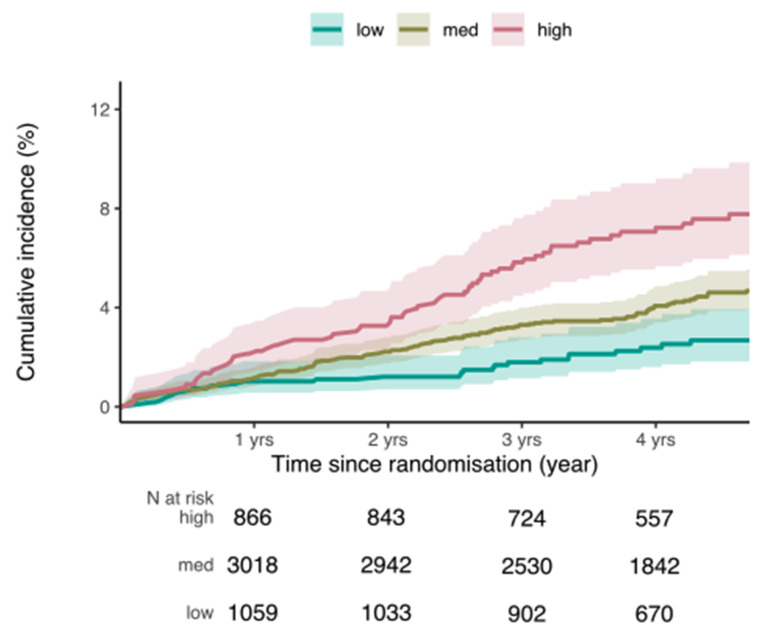
Figure 1.
Competing risk survival curves for incident prostate cancer by PRS group. Low risk = PRS 0–20% (blue line); medium risk = PRS > 20–80% (yellow line); high risk = PRS > 80–100% (red line). Cumulative incidence of prostate cancer risk accounting for competing risk (death) is plotted, with groups stratified according to PRS group.

