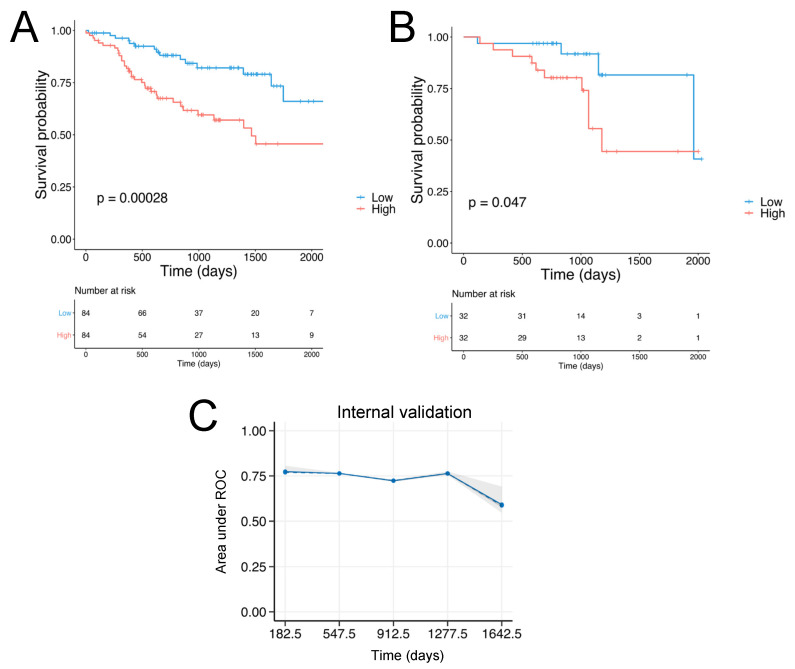
Figure 2.
Identification of the SCHNN TMI and evaluation of its prognostic value. (A) Kaplan−Meier plots for the HPV−, N0 subgroup (n = 168). (B) Kaplan−Meier plots for the HPV−, N0 subgroup for the validation set (n = 64). (C) Internal validation: the performance of the elastic-net model is internally assessed by time-dependent AUC (area under the ROC curve) with “bootstrap” resampling at every year from the first 6 months to the year 4.5. The solid line represents the mean of the AUC at each time point across all bootstrap predictions, the dashed line represents the median of the AUC. The shaded interval shows the minimum and maximum of AUC.

