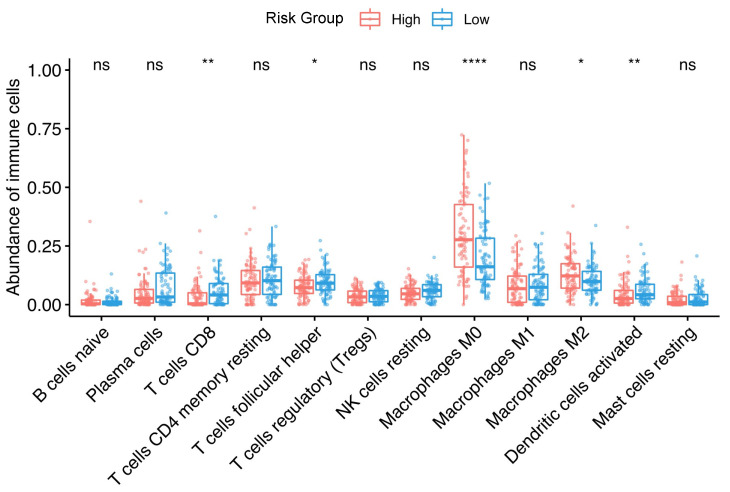
Figure 5.
Association between SCCHN TMI risk group and infiltrative immune cells. The box plots show the percentages of infiltrative immune cells calculated by CIBERSORTx between high- and low-risk groups in the “TCGA-HNSC”, HPV−, N0 subgroup. The size of the boxes indicates the interquartile range IQR which spans from the first quartile (Q1) to the thirst quartile (Q3). The whiskers indicate the range from Q1 + 1.5 × IQR to Q3 − 1.5 × IQR and the line is the median. A two-sided, unpaired two-sample Wilcoxon test was performed between the two groups. **** p ≤ 0.0001; ** p ≤ 0.01; * p ≤ 0.05, ns: not significant.

