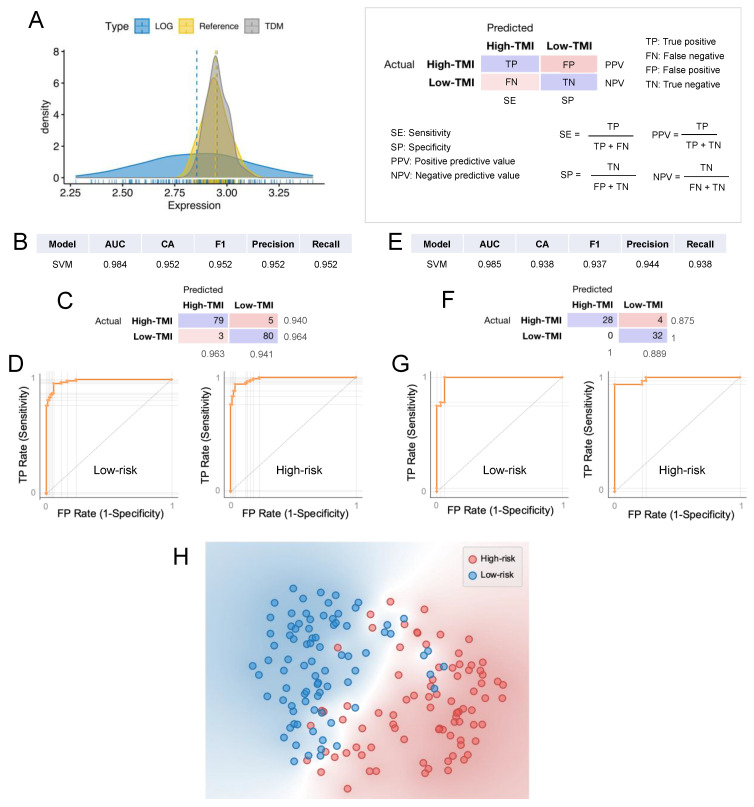
Figure 6.
Computational classification of the SCCHN TMI risk group at the individual patient level. (A) Comparison between TDM and LOG-transformed training data (TCGA) in fitting the validation dataset (GSE65858) distribution. (B) Results of the classification model evaluation using 10-fold cross-validation. (C) Confusion matrix of the support vector machine (SVM) model, which best scored in the classification. (D) Receiver operating characteristic (ROC) curves for each of the SCCHN TMI risk groups using SVM. (E) Results of the classification model evaluation using the validation dataset. (F) Confusion matrix of the support vector machine (SVM) model. (G) Receiver operating characteristic (ROC) curves for each of the SCCHN TMI risk groups using SVM. AUC = area under the curve, CA = classification accuracy. (H) The t-SNE plot of two risk groups.

