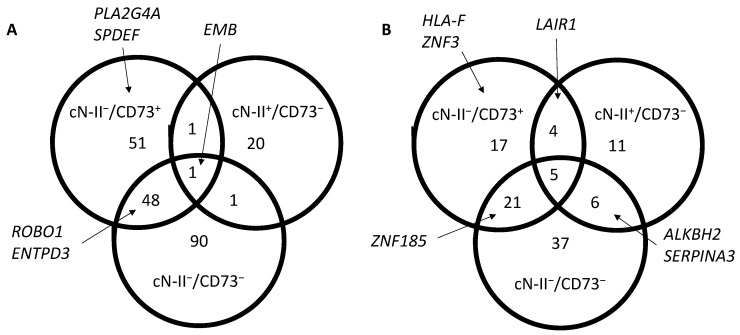
Figure 1.
Venn diagrams showing the number of transcripts with at least a 5-fold higher (A) or lower (B) expression than in cN-II+/CD73+ cells, and with a p-value lower than 0.05. Only transcripts that were positive (FPKm > 1) in at least one model were included in the analysis. Complete list of transcripts is available in Supplementary Table S2.

