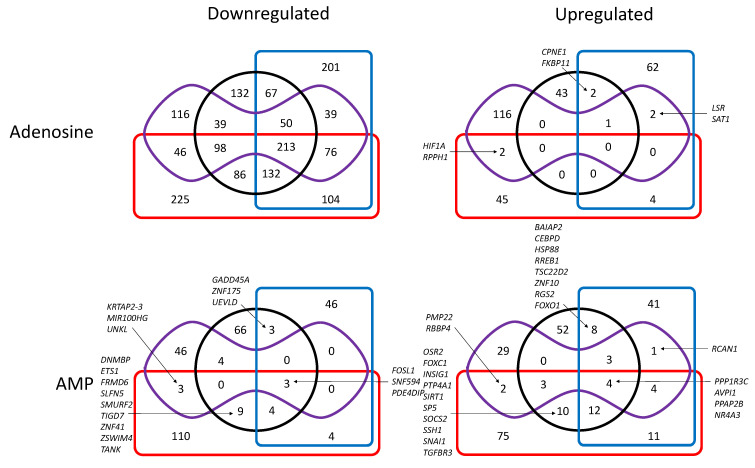
Figure 3.
Venn diagram showing the number of at least 2-fold down- (left) or upregulated (right) transcripts (p < 0.05) in cells exposed to adenosine (upper panel) or AMP (lower panel) as compared to unexposed cells. Black circle: cN-II+/CD73+; red rectangle: cN-II−/CD73+; blue rectangle: cN-II+/CD73−; purple shape: cN-II−/CD73−. When the number of transcripts is less than 10 in given groups, the names of transcripts are indicated. Complete list of transcripts is available in Supplementary Tables S4 and S5.

