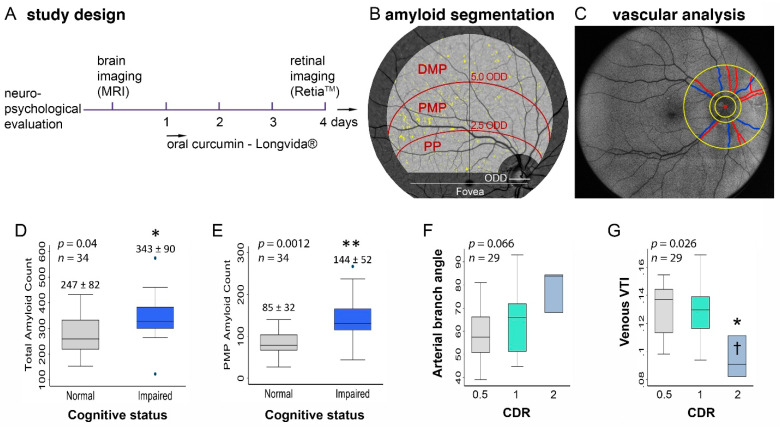
Figure 1.
Study timeline of brain and retinal imaging followed by sectoral amyloid and vascular analysis. Study design scheme illustrating that subjects underwent baseline brain imaging and neuropsychological evaluation, followed by retinal fluorescence imaging after 4 days of daily oral curcumin intake (A). Illustration of the region of interest in the right eye supero-temporal retinal quadrant and its three subregions, which were used for quantifying retinal amyloid counts (B). Illustration of the region of interest used for the retinal vascular analysis. The red circle indicates the center of the optic nerve-head and the smallest yellow circle shows the optic nerve-head area. The two larger circles indicate the region of interest for the vascular analysis, which were 1.5 and 4 times the diameter of the optic disc. The branching angle and tortuosity of vessels within the region of interest were calculated. Arteries and veins are outlined by red and blue lines, respectively (C). Graphs illustrating differences in total amyloid (D) and proximal amyloid counts (E) when stratified by cognitive status. Graphs illustrating the differences between arterial branching angle (F) and the venous tortuosity index (G) when stratified by CDR. * p < 0.05; ** p < 0.01, by two-tailed unpaired student t-test or one-way ANOVA and Bonferroni’s post-hoc test. Abbreviations: MRI, magnetic resonance imaging; PP, posterior pole; PMP, proximal mid-periphery; DMP, distal mid-periphery; ODD, optic disc diameter; CDR, Clinical Dementia Rating; and VTI, vessel tortuosity index.

