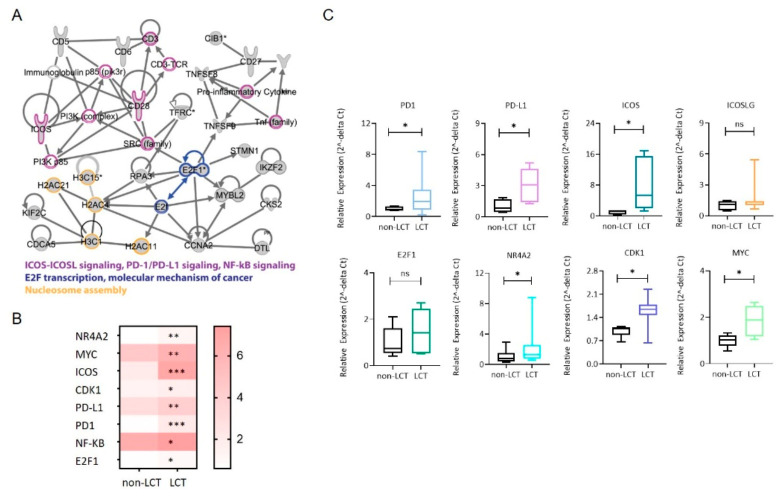
Figure 4.
Identification of signaling network of upregulated mRNAs that positively correlate with miR-21 and miR-146a. (A) Functional interaction network of upregulated genes in LCT-MF. The 130 genes that are upregulated in LCT-MF and positively associated with miR-146a and miR-21 were subjected to network analysis using Ingenuity Pathway Analysis (IPA). The nodes are colored based on their associated canonical pathways. (B) Heatmap visualization of differential expression key genes in MF-LCT vs. non-LCT. * p < 0.05, ** p < 0.01, *** p < 0.001. (C) qRT-PCR validation of key genes of the targeted signaling in LCT-MF and non-LCT lesional skin samples. Data are shown as means ± SD. Variables were analyzed using Student’s t test (* p < 0.05); ns, no significant difference.

