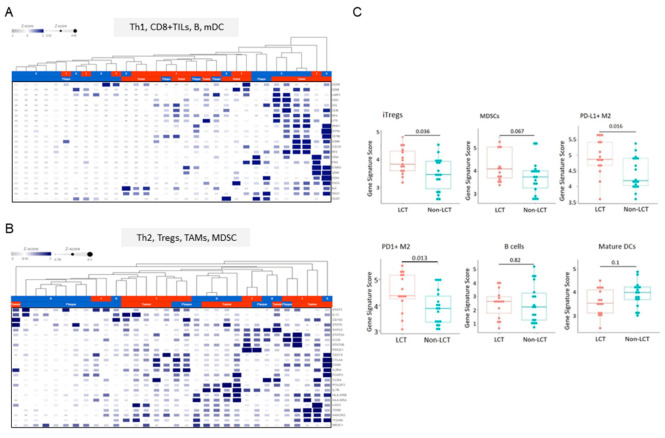
Figure 5.
Immune cell gene signatures in the microenvironment of LCT-MF vs. non-LCT. Heatmap visualization of RNA-Seq data: Th1, CD8+ TILs, and B cells (A) Th2, Tregs, TAMs, MDSCs and DCs signature (B) in the microenvironment of MF-LCT vs. non-LCT. (C) RNA-Seq analysis with genes scored by −log2 (RPKM) to evaluate the genetic expression of iTregs, MDSCs, PD-L1+ M2, PD1+ M2, B cells, and mature DCs in MF-LCT vs. non-LCT. “limma” was used with p-value < 0.05 and fold change > 1.5 as the cutoff values.

