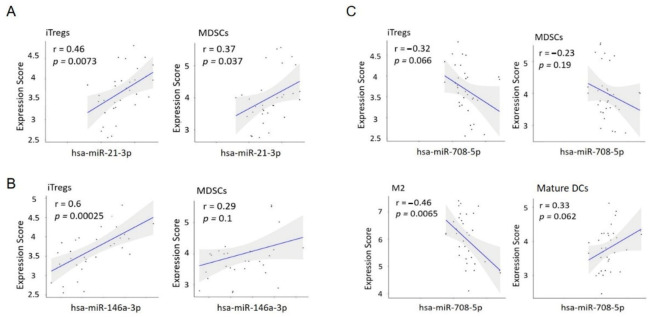
Figure 6.
The correlation analysis of miR expression and the immune cell gene score in MF-LCT. (A) Correlation analysis of miR-21-3p with iTregs and MDSCs in MF-LCT. (B) Correlation analysis of miR-146a-3p with iTregs and MDSCs in MF-LCT. (C) Correlation analysis of miR-708-5p with iTregs, MDSCs, TAM (M2) and immature DCs in MF-LCT. Pearson’s correlation coefficient.

