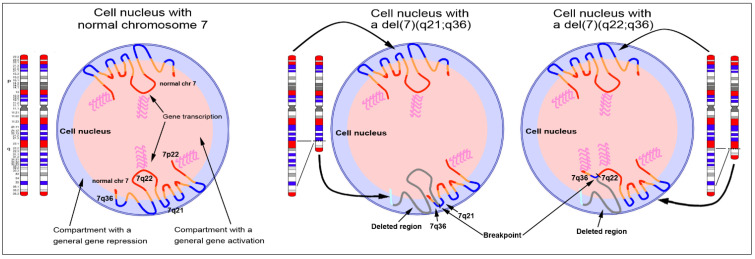
Figure 3.
Effect of chromosomal rearrangements on gene expression. The image shows three nuclei with the zig-zag organization of the two chromosomes 7. Ideograms of the two homologous chromosomes 7 show the GC-richest (red) and the GC-poorest (blue) bands. The image shows three drawings of nuclei with two normal copies of chromosome 7 (left), one chromosome 7 carrying an interstitial deletion between 7q21 and 7q36 (middle), and one chromosome 7 with an interstitial deletion between 7q22 and 7q36 (right). Based on the new environmental conditions in which the terminal bands of chromosome 7 will be found after the deletion, activation of the genes involved in the rearrangement may occur, as observed for the MNX1 allele in patients with hematological disorders. The nucleus on the right shows the case of gene activation by repositioning the 7q36 band in a transcriptionally active compartment (close to the GC-rich 7q22 band), as opposed to what is presented in the nucleus in the center, where the deletion involving the GC-poor 7q21 band keeps the 7q36 band in the same transcriptionally inactive compartment. Modified from [97].

