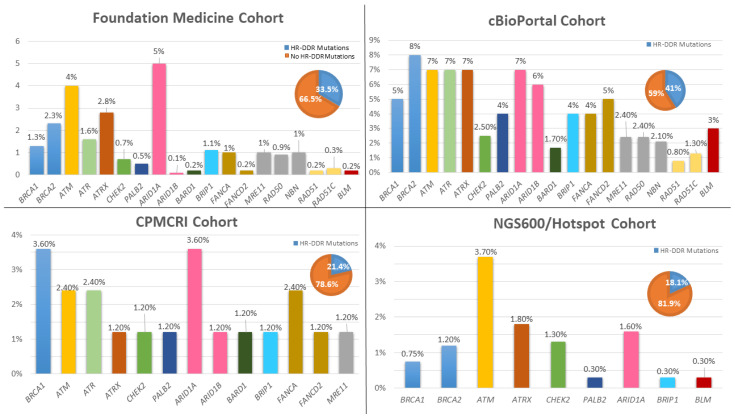
Figure 5.
Frequency of commonly mutated genes of the HR-DDR pathway in melanomas from different cohorts including: FoundationOne medicine (n = 1986), cBioPortal (1088), CPMCRI (84), and NGS600/Hotspot (n = 670) cohorts. Bar charts represent the percentage of specific gene mutations in each cohort. Pie charts represent the percentage of melanoma samples with at least one mutation in the HR-DDR pathway. HR-DDR: Homologous recombination-DNA damage response. Pie charts: blue color represents the percentage of melanoma specimens harboring at least 1 mutant gene from homologous recombination pathway. The orange color represents percentage of melanoma specimens without homologous recombination gene mutations. CPMCRI: California Pacific Medical Center Research Institute. NGS: Next-generation Sequencing.

