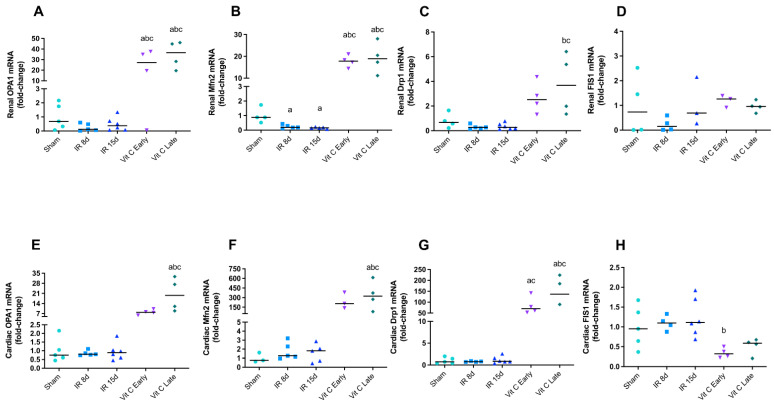
Figure 2.
Mitochondrial dynamic components in CRS 3 model after vitamin C treatment. OPA 1 mRNA levels (A), Mitofusin 2 mRNA levels (B), Drp 1 mRNA levels (C), and FIS 1 mRNA levels (D) in the left kidney. OPA 1 mRNA levels (E), Mitofusin 2 mRNA levels (F), Drp 1 mRNA levels (G), and FIS 1 mRNA levels (H) in the heart. Data are expressed as the mean ± standard error of mean (SEM), and one-way ANOVA followed by the Tukey’s post hoc test were performed. a vs. sham, p < 0.05. b vs. IR8d, p < 0.05. c vs. IR15d, p < 0.05.

