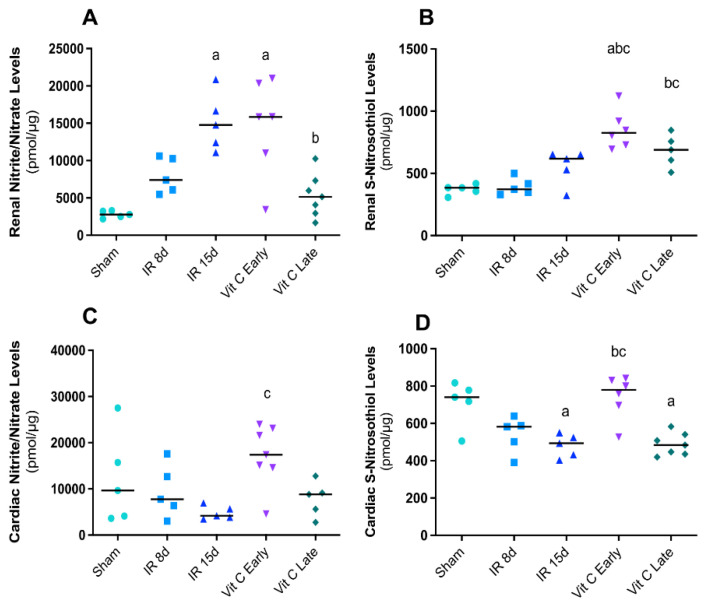
Figure 5.
Impact of vitamin C on nitric oxide levels in CRS 3. Nitrite levels (A) and S-nitrosotiol levels (B) in the kidney. Nitrite levels (C) and S-nitrosotiol levels (D) in the heart. Data are expressed as the mean ± standard error of mean (SEM), and one-way ANOVA followed by the Tukey’s post hoc test were performed. a vs. sham, p < 0.05. b vs. IR8d, p < 0.05. c vs. IR15d, p < 0.05.

