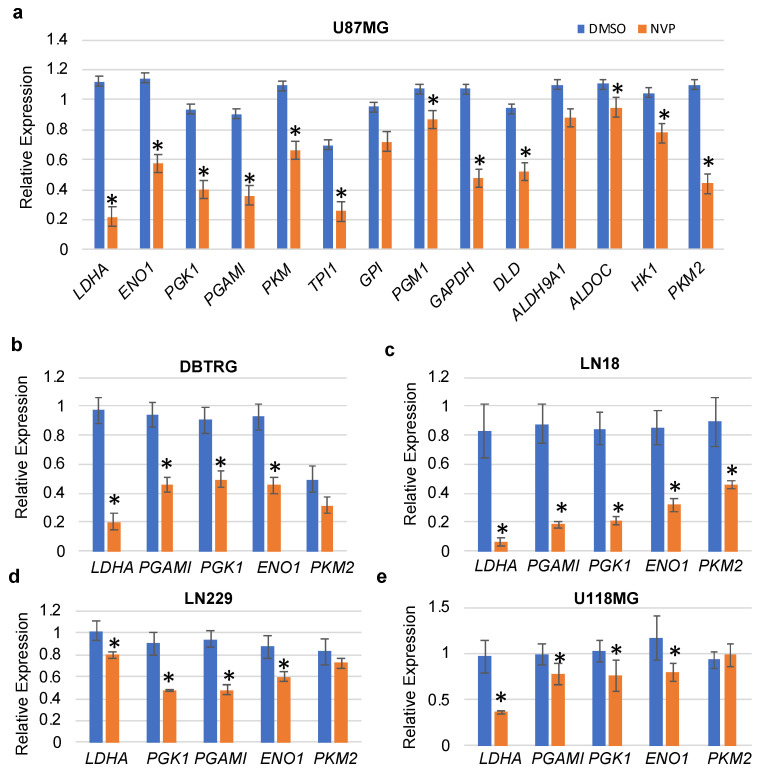
Figure 3.
qRT-PCR validation of the glycolytic genes in various cell lines. (a) U87MG, (b) DBTRG, (c) LN18, (d) LN229, and (e) U118MG. The relative expression of the genes (compared to ACTB, encoding actin) was analyzed in control and NVP-BEZ235 (NVP) samples (1 μM treatment for 5 days). The error bars represent the standard deviation of the genes (n = 4). Asterisks (*) represent the significantly expressed genes (p < 0.05) as compared to control (DMSO). Significance was determined by Student’s t-test.

